In an experiment that measures a system over time — frame rate, throughput, latency — each run produces one number, such as the mean fps. If the runs are too short, that number is noisy, and repeating the same experiment gives a different answer. If the runs are too long, time is wasted that could have gone into more runs or more conditions. The question - how long a run is "long enough" and how to figure this out?
This technique finds the shortest run length whose result is (about) as repeatable as a much longer run.
Pick the metric. This is the per-run number you will report, such as mean f/s, median f/s or 1%-low f/s. Run the analysis separately for each metric, because tail metrics like 1%-low need longer runs than the mean does.
Pick candidate lengths. Space them roughly geometrically, for example 5, 10, 15, 20, 30, 45, 60, 90, 120, 180, 240 and 300 s (i.e., step size 5, then 10, then 15, then 30, then 60).
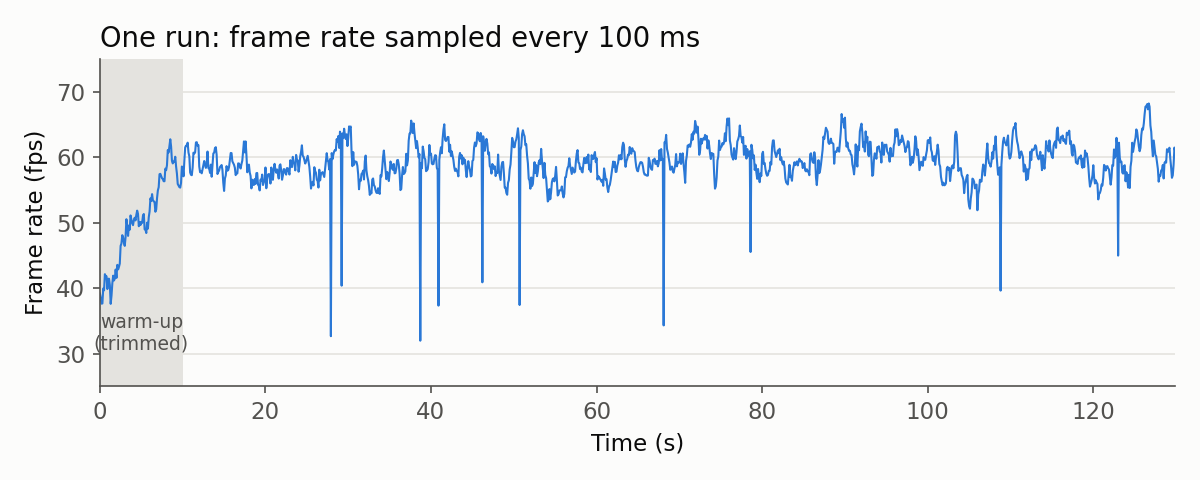
Remove warm-up. Drop "warm-up" time (e.g., cache fill, page-faults, clock ramp-up) from the front of the run before measuring. Run length means the measured part only.
Repeat runs at each length. Use N independent runs per length. Aim for 20–30, but at least 10. You can get this cheaply by recording N long runs and truncating each one to the first L seconds after warm-up.
Compute the std dev of the metric across runs at each length.
Plot std dev against run length. The curve typically falls steeply at first and then flattens.
Find the knee. This is the shortest length at which the curve has effectively reached its plateau. One concrete rule is the shortest L whose std dev is within about 25% of the plateau, where the plateau is the mean std dev of the longest few lengths. Another is the first L whose confidence band overlaps the plateau.
Pick a run length just past the knee. To be "safe" and make sure it is long enough, pick a length that is past the knee and in the "flat" part of the curve. This assumes it is better to waste a bit of time (i.e., with longer runs) than it is to get the wrong answer (i.e., from shorter runs). A simple rule is the first candidate length at least 2× the knee.
The variance of a run's mean has two parts:
Var(run mean) ≈ σ²_between + σ²_within · τ / Lσ²_within · τ / L is the sample-to-sample fluctuation averaged over the run. Here τ is the correlation time, meaning how long a slow or fast stretch tends to last. This term shrinks as the run gets longer.
σ²_between is run-to-run variation that a longer run cannot remove - i.e., the natural variation in the underlying system (background processes, OS scheduling, a different random seed or map, driver state). This term is the plateau.
Once the first term is small compared with the second, a longer run does not give more value - the only way to gain more precision then is more runs.
Special Case: if the curve never flattens and keeps falling like 1/√L, the between-run variance is negligible. In that case, choose the length that gives the precision needed (see the alternatives below in the example) instead of looking for a knee.
Assume this setup:
A single run is depicted in Figure 1.
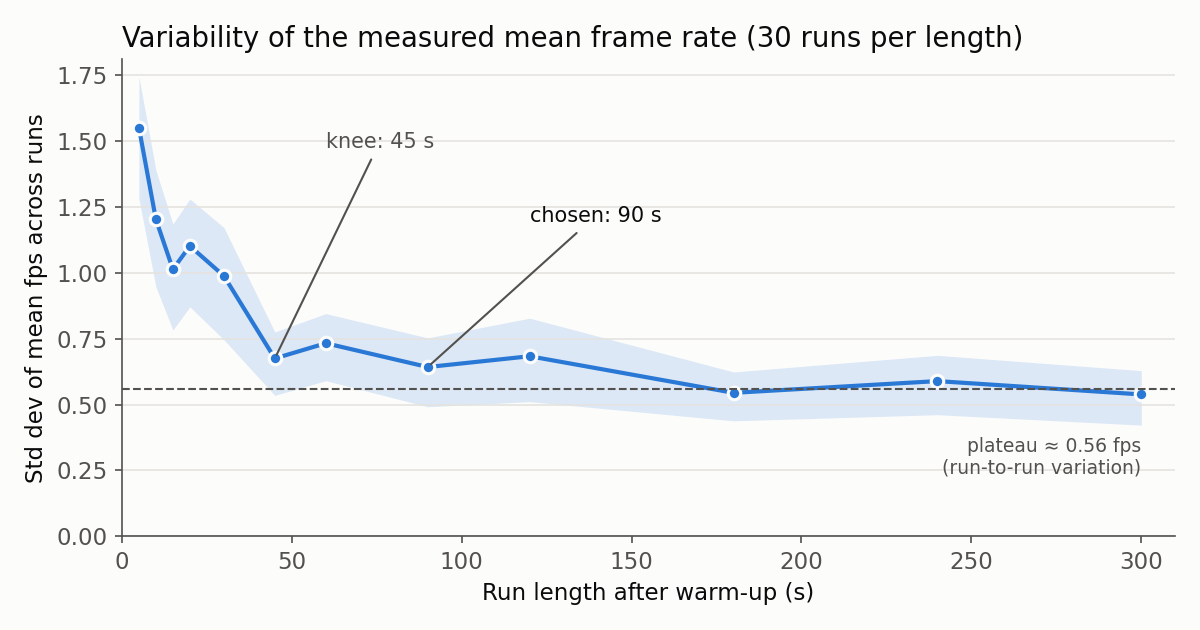
The std dev of the per-run mean f/s across the 30 runs, at each length. The table data is below (knee in italics, chosen length in bold).
| Length (s) | 5 | 10 | 15 | 20 | 30 | 45 | 60 | 90 | 120 | 180 | 240 | 300 |
|---|---|---|---|---|---|---|---|---|---|---|---|---|
| Stddev (f/s) | 1.55 | 1.20 | 1.01 | 1.10 | 0.99 | 0.67 | 0.73 | 0.64 | 0.68 | 0.54 | 0.59 | 0.54 |
A graph of the data is in Figure 2, with the shaded band is a bootstrap 90% interval on each std dev.
From Figure 2:
Below about 30 s: 5 s runs give std dev ≈ 1.5 f/s. If two configurations differ by 1 f/s, they cannot be told apart with runs this short.
Knee at 45 s: the curve has reached ≈ 0.67 f/s. That is within 25% of the ≈ 0.56 f/s plateau, and the confidence band overlaps the plateau.
Chosen at 90 s: 2× the knee, well into the flat part of the curve (≈ 0.64 f/s). The margin covers the noise in locating the knee (45 s vs. 60 s is within that noise) and workloads that settle a little more slowly than this one.
From 45 s to 300 s: runs get 6.7× longer, but the std dev only falls from 0.67 to 0.54 f/s. The remaining variation comes from run to run, not from within a run.
Decision: use 90 s runs after a 10 s warm-up. If more precision is needed, spend the saved time on more runs. The std error of the mean across k runs is ≈ plateau / √k, so 10 runs give ≈ 0.18 f/s.
Noise in the std dev itself. The std dev estimate is noisy. With N = 30 runs, its relative error is ≈ 1/√(2(N−1)) ≈ 13%. The small bumps in the curve (15 s vs. 20 s, 45 s vs. 60 s) are that noise. Don't set a knee threshold tighter than about 2× that error.
Match production conditions. Use the same scene or path, settings and machine state that the real experiments will use. The knee depends on the workload.
Metrics differ. Percentiles and 1%-lows converge more slowly than the mean, so check the metric you will actually report.
Watch for rising curves. If the std dev goes up again at long lengths, something is drifting within a run, such as thermal throttling, a memory leak or a background task. Fix that, or report it, before choosing a length.