commit 1556b791beb923cd827fd2d2809509828cfc3030 Author: Mark Claypool <claypool@cs.wpi.edu> Date: Wed Sep 30 17:54:12 2026 -0400 Add run-length guide and fix web build/publish - Add run-length.md with its two figures and list it in the web index. - make-guides.sh: copy images into upload/ so pandoc can find them. - Build PDFs with xelatex and DejaVu fonts so Unicode (≈, σ, τ) works. - copy-web.sh: upload .png files, use full path to fix-perms.sh, print actual start/end times. Co-Authored-By: Claude Opus 5.5 <noreply@anthropic.com> diff --git a/run-length.md b/run-length.md new file mode 100644 index 0000000..abe9b94 --- /dev/null +++ b/run-length.md @@ -0,0 +1,151 @@ +# Run Length - Choosing an Experimental Run Length + +## The Question + +In an experiment that measures a system over time — frame rate, +throughput, latency — each run produces one number, such as the mean +fps. If the runs are too short, that number is noisy, and repeating +the same experiment gives a different answer. If the runs are too +long, time is wasted that could have gone into more runs or more +conditions. The question - how long a run is "long enough" +and how to figure this out? + +## Using Standard Deviation to Choose Run Length + +This technique finds the shortest run length whose result is (about) +as repeatable as a much longer run. + +1. **Pick the metric.** This is the per-run number you will report, +such as mean f/s, median f/s or 1%-low f/s. Run the analysis +separately for each metric, because tail metrics like 1%-low need +longer runs than the mean does. + +2. **Pick candidate lengths.** Space them roughly geometrically, for +example 5, 10, 15, 20, 30, 45, 60, 90, 120, 180, 240 and 300 s (i.e., +step size 5, then 10, then 15, then 30, then 60). + +3. **Remove warm-up.** Drop "warm-up" time (e.g., cache fill, +page-faults, clock ramp-up) from the front of the run before +measuring. Run length means the measured part only. + +4. **Repeat runs at each length.** Use N independent runs per length. +Aim for 20–30, but at least 10. You can get this cheaply by recording +N long runs and truncating each one to the first *L* seconds after +warm-up. + +5. **Compute the std dev of the metric across runs** at each length. + +6. **Plot std dev against run length.** The curve typically falls +steeply at first and then flattens. + +7. **Find the knee.** This is the shortest length at which the curve +has effectively reached its plateau. One concrete rule is the +shortest *L* whose std dev is within about 25% of the plateau, where +the plateau is the mean std dev of the longest few lengths. Another +is the first *L* whose confidence band overlaps the plateau. + +8. **Pick a run length just past the knee.** To be "safe" and make +sure it is long enough, pick a length that is past the knee and in the +"flat" part of the curve. This assumes it is better to waste a bit of +time (i.e., with longer runs) than it is to get the wrong answer +(i.e., from shorter runs). A simple rule is the first candidate +length at least 2× the knee. + +### Why the Curve Flattens + +The variance of a run's mean has two parts: + +``` +Var(run mean) ≈ σ²_between + σ²_within · τ / L +``` + +- **σ²_within · τ / L** is the sample-to-sample fluctuation averaged + over the run. Here τ is the correlation time, meaning how long a + slow or fast stretch tends to last. This term shrinks as the run + gets longer. + +- **σ²_between** is run-to-run variation that a longer run cannot + remove - i.e., the natural variation in the underlying system + (background processes, OS scheduling, a different random seed or + map, driver state). This term is the **plateau.** + +Once the first term is small compared with the second, a longer run +does not give more value - the only way to gain more precision then is +more runs. + +> **Special Case:** if the curve never flattens and keeps falling like +> 1/√L, the between-run variance is negligible. In that case, choose +> the length that gives the precision needed (see the alternatives +> below in the example) instead of looking for a knee. + +## Example: Game Frame Rate + +Assume this setup: + +- The frame rate is sampled every 100 ms, with a nominal 60 f/s. +- A 10 s warm-up ramps up from about 40 f/s and is trimmed from each + run. +- The frame-to-frame fluctuation is correlated over time, and + occasional stutters drop 15–30 f/s. +- Each run gets a random offset with std dev 0.5 f/s, standing in for + thermal and background-load effects. +- There are 30 runs at each of 12 candidate lengths. + +A single run is depicted in Figure 1. + +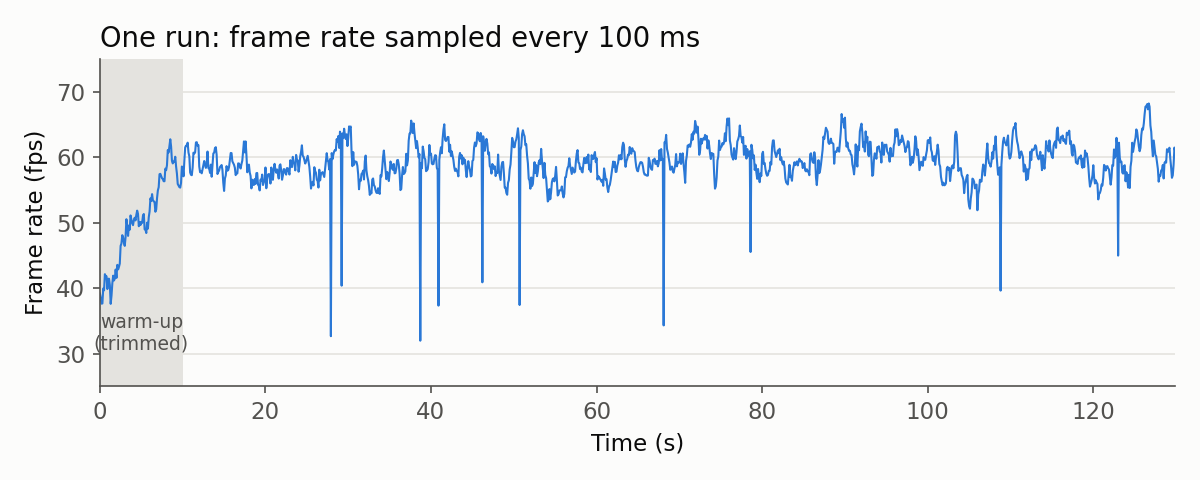 + +The std dev of the per-run **mean f/s** across the 30 runs, at each +length. The table data is below (knee in italics, chosen length in bold). + +| Length (s) | 5 | 10 | 15 | 20 | 30 | *45* | 60 | **90** | 120 | 180 | 240 | 300 | +|---|---|---|---|---|---|---|---|---|---|---|---|---| +| Stddev (f/s) | 1.55 | 1.20 | 1.01 | 1.10 | 0.99 | *0.67* | 0.73 | **0.64** | 0.68 | 0.54 | 0.59 | 0.54 | + +A graph of the data is in Figure 2, +with the shaded band is a bootstrap 90% interval on each std dev. + +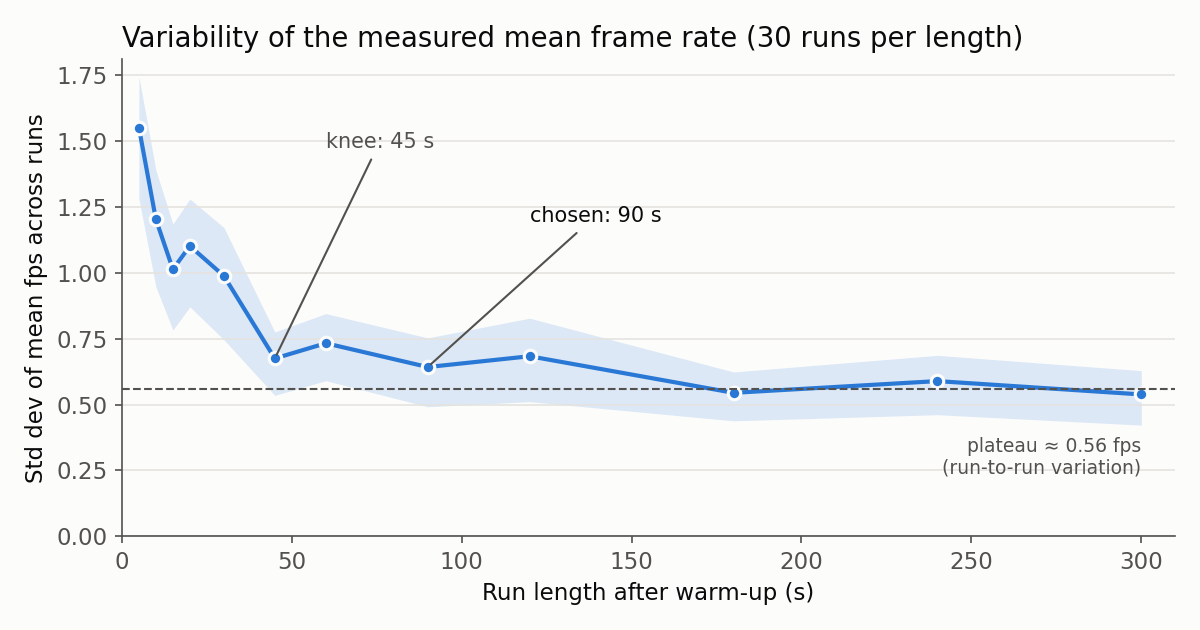 + +From Figure 2: + +- **Below about 30 s:** 5 s runs give std dev ≈ 1.5 f/s. If two + configurations differ by 1 f/s, they cannot be told apart with runs + this short. + +- **Knee at 45 s:** the curve has reached ≈ 0.67 f/s. That is within + 25% of the ≈ 0.56 f/s plateau, and the confidence band overlaps the + plateau. + +- **Chosen at 90 s:** 2× the knee, well into the flat part of the + curve (≈ 0.64 f/s). The margin covers the noise in locating the + knee (45 s vs. 60 s is within that noise) and workloads that settle + a little more slowly than this one. + +- **From 45 s to 300 s:** runs get 6.7× longer, but the std dev only + falls from 0.67 to 0.54 f/s. The remaining variation comes from run + to run, not from within a run. + +- **Decision:** use 90 s runs after a 10 s warm-up. If more precision + is needed, spend the saved time on more runs. The std error of the + mean across *k* runs is ≈ plateau / √k, so 10 runs give ≈ 0.18 f/s. + +## Practical notes + +- **Noise in the std dev itself.** The std dev estimate is noisy. + With N = 30 runs, its relative error is ≈ 1/√(2(N−1)) ≈ 13%. The + small bumps in the curve (15 s vs. 20 s, 45 s vs. 60 s) are that + noise. Don't set a knee threshold tighter than about 2× that error. + +- **Match production conditions.** Use the same scene or path, + settings and machine state that the real experiments will use. The + knee depends on the workload. + +- **Metrics differ.** Percentiles and 1%-lows converge more slowly + than the mean, so check the metric you will actually report. + +- **Watch for rising curves.** If the std dev goes *up* again at long + lengths, something is drifting within a run, such as thermal + throttling, a memory leak or a background task. Fix that, or report + it, before choosing a length. +