[WPI] [cs2223] [cs2223 text] [News] [Syllabus] [Classes]
Note: This page contains an attached Excel spreadsheet. A zip version is also atached for those whose browsers do not reliably download spreadsheet files.
In Class 3, we showed how to write the recurrence relation for an algorithms, one which creates identity matrices. There are two parts to the process: writing a recurrence relation which accurately models the relationship between successive values in a sequence, and solving the recurrence relation. We used simulation - a computer program actually created the identity matrices and counted the number of replacement statements - to validate the recurence relationship. We can similarly use calculations to validate the solution of the recurrence relation. The first page of the attached spreadsheet uses direct comparison of the first one-hundred elements of the sequence to verify that
![]()
is the solution to the recurrence relation:
![]()
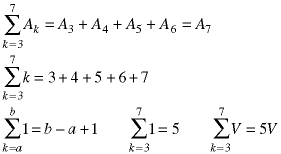
The summation symbol is a shorthand notation for the sum of terms:

Summations are widely used in analyzing algorithms. The core of the identity()
algorithm shown in Class 3 is two
nested for loops:
replacements = 0;for (int y = 0; y < n; y++)for (int x = 0; x < n; x++){if (x == y) replacements++, *(array + n * y + x) = 1;else replacements++, *(array + n * y + x) = 0;}
The additions (increments) of replacements can be modeled
as nested summations:

This is the result we found and proved to be correct in Class 3.
Summations are also useful for calculating average case results. In Class 1 and Class 3 we analyzed an algorithm for finding the minimum element in an array.
To calculate the average height, called the Expected Value, of the students in cs2223, we would add all of the heights and divide by the number of students:
![]()
In this equation, S is the number of students, and hk is the height of the k-th student.
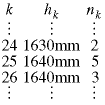
Sometimes we group students who have the same height and reduce the number of the terms by making the summation over groups:

![]()
The upper limit N is the number of groups. It is often less than S, the number of students, but they can be equal in the case when the height measurements are so precise that the groups are all of size one.
We can take the constant inside the summation:
![]()
The probability of being in group k - which means the probability of having height hk - equals the number of students in the group divided by the total number of students. This result can be generalized. The average value of anything can be found by summing all possible values times their respective probabilities of occurrence.
minval()We used the last result to calculate the average number of replacements
in the function minval(), which we introduced in Class
3. We use the average value to characterize this algorithm because the
spread between the best-case and worst-case performance is so extreme. The
best case (minimum number of replacements) occurs when the array elements
are in ascending order; only one replacement occurs. The worst case (maximum
number of replacements) occurs when the array elements are in descending
order; the minimum value is replaced by every array value in succession.
To calculate the average number of replacements, look at each element in the array, starting at the beginning. For each element, find the probability that it is smaller than any or the previous elements. Multiply that probabilitiy by the amount the replacement count will increase (one) if it actually is lower than any which came before. The sum of these terms is the average replacement count:
![]()
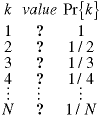
 To calculate the probabilities, consider the array. The probability
that the first element is a minimum (smaller than any which came before)
is one. Now look at the second element in the array. If we know nothing
about the values in the array, it is reasonable to assume that they are
in random order. That means that any of the values could be the minimum.
So it is equally likely that the second elment is larger than the first
as it is that the second is smaller than the first. That means the probability
that the second is a minimum is one-half. When we get to the third element
in the array, it's probabiliity of being smaller than either of the first
two elements is one-third, and so forth.
The average number of replacements in the function minval is:
![]()
This is called the harmonic series and it shows up often when analyzing algorithms. The harmonic series cannot be reduced to anything simpler, but it is approximately equal to:
![]()
The constant, known as Euler's constant, is an irrational constant of nature, such as pi or e. This means that the number of replacements grows roughly as the log of the array size. This approximation is good for values of N greater than about 10, as shown in the second page of the attached spreadsheet. The spreadsheet also contains a function - written in Visual Basic, the macro language of Excel - which calculates the harmonic series.
We tested our calculation with the simulation minval2.C.
The source code is contained in the CCC directory:
/cs/cs2223/classes/class04/
The attached script shows the calcuation. In the third page of the attached spreadsheet, we compared the measured values from five simulations with the calculated value.
The minval2.C code contains this algorithm for calculating
the average of the number of replacements when the
average = 0.0;for (int n = 1; n <= NMAX; n++) // average NMAX cases{for (int i = 0; i < array_size; i++) array[i] = i + 1;// fill the array in ordershuffle(array_size, array); // shuffle the arrayreplaces = 0;minval(array_size, array); // find minimum value then ignore itaverage = ((n - 1) * average + replaces) / (float)n;} // end for(n)
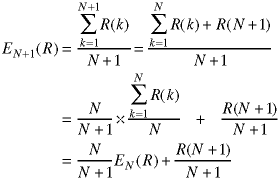
The next to the last line ia a running average. Instead of adding the
total number of replacements and dividing by NMAX, we updated
the average each time through the loop. Assume we know the average number
of replacements after we have gone through the loop N times:

The next time through the loop, N+1, the average is:

If we replace N+1 by N, we obtain the running average:
![]()
In the above code, we express this as the command:
average = ((n - 1) * average + replaces) / n;
![]()
![[WPI Home Page]](../../images/wpi_logo_small.gif) |