Improvements to Collaborative Filtering Algorithms
by
Anuja Gokhale
A Thesis
Submitted to the Faculty
of the
WORCESTER POLYTECHNIC INSTITUTE
In partial fulfillment of the requirements for the
Degree of Master of Science
in
Computer Science
May 1999
APPROVED:
Major Advisor
Prof. Mark Claypool
Head of Department
Prof. Micha Hofri
The explosive growth of mailing lists, Web sites and Usenet news has caused information overload. It is no longer feasible to search through all the sources of information available in order to find those that are of interest to an individual user.
Collaborative filtering systems recommend items based upon opinions of people with similar tastes. Collaborative filtering overcomes some difficulties faced by traditional information filtering by eliminating the need for computers to understand the content of the items. Further, collaborative filtering can also recommend articles that are not similar in content to items rated in the past as long as like-minded users have rated the items. Unfortunately, collaborative filtering is not effective when there are too few users that have rated an item or for users that do not have a strong history or correlation with other users.
Content-based systems use content to filter or recommend items. These perform well when users know and specify topics in which they are interested. Recommendations for a user are based solely on a profile built by analyzing the content of the items which that user has rated in the past. Content based filters face problems of over-specialization. When the system can only recommend items scoring highly against a user's profile, the user is restricted to seeing items similar to those she has already seen. Also, it is often difficult for content-based filters to understand the meaning of text or even the actual content of complex items.
We combine the strengths of content-based filtering techniques with collaborative filtering to provide more accurate recommendations. We use thresholds to improve the accuracy of traditional filtering algorithms, and design and implement a way to apply content-based filtering to an online newspaper. We compare our improved algorithms to current algorithms using both off-line and online experiments and show that these result in more effective filters that can help manage the massive amount of information that is confronting us today.
I would like to thank my thesis advisor Prof. Mark Claypool for his advice and support throughout this entire project. Thank god they still make such advisors! I would also like to thank Prof. George Heineman, Prof. Carolina Ruiz and Prof. Sergio Alvarez for bearing with me at all the times I have burst into their office for guidance or ideas.
I am also grateful to my friends, Chandrakant Natarajan, Jens Peter Kaps and Andreas Koeller, my roommates Charu Vepari and Allegra Treaster and my office mate Peter Leveille for helping me maintain my sanity during the tough times and for tolerating me when I occasionally crossed the line between genius and madness!
Last but not least, I would also like to thank my parents for deciding to come for my graduation thus leaving me with no option but to graduate in time !
1.5
Recent years have seen the explosive growth in the amount of information. The amount of information available through books, movies, news, television programmes, advertisements, and in particular on-line sources, such as email, Usenet News, Web documents, is staggering. An individual cannot hope to absorb even a tiny fraction of today's information, and, to make things worse, more information is added daily!
The World Wide Web started in 1990
and grew to over 10,000 Web sites by December 1994 [RIS94]
and to 650,000 Web sites by January 1997 [Gra99]. Together
these servers exported a minimum of 1.05 million documents.
Furthermore, studies in 1996![]() have shown that the Web is filled with transient information.
In 1996, there were an estimated 50 million pages on the Web and each
page was online for only an average of 75 days. Other recent
surveys have estimated the number of Web users
in the U.S. as of May 1998 at 57,037,000 and the number of Web pages as
of April 1998 at approximately 320 million [Tre98b]!
Furthermore, the number of pages is doubling every year. Using
the average Web page size of 30 kilobytes (including graphics)
brings the current size of the Web to 1.5 terabytes (or
million megabytes).
have shown that the Web is filled with transient information.
In 1996, there were an estimated 50 million pages on the Web and each
page was online for only an average of 75 days. Other recent
surveys have estimated the number of Web users
in the U.S. as of May 1998 at 57,037,000 and the number of Web pages as
of April 1998 at approximately 320 million [Tre98b]!
Furthermore, the number of pages is doubling every year. Using
the average Web page size of 30 kilobytes (including graphics)
brings the current size of the Web to 1.5 terabytes (or
million megabytes).
Usenet News is also growing exponentially. Estimates show that in May 1993 there were over 2.6 million users of Usenet News at almost 87,000 sites that generated over 26 thousand new articles a day [Tre98a]. A year later, the estimated number of users on Usenet News had risen to almost 10 million. Other surveys have also estimated a 140 percentage increase in the number of on-line auction sites listed by Yahoo from April to June, 1997 [Tre98a].
Studies have also shown that on average, a video store holds about 5,000 video titles, a music radio station holds about 10,000 LPs and CDs [Sta99]. The Library of Congress contains about 20 million books.
The adoption of media like the email by corporations, governmental and educational institutes and the widespread use of newsgroups further compounds the problem of information overload. These media, being effective means for fast coordination, dissemination and retrieval of information, bring with them the problem of information overload. Information overload in new electronic media stems from the skewed relationship between the costs of the sender of the information and those of the recipient in relation to other media. Once the sender has created the information, the cost (in both money and effort) of sending it to many recipients is relatively low. The problem (from the recipients point of view) with electronic media is that they shift virtually all the power from the recipient to the sender. This shift in power makes it very important to develop automatic techniques to filter information at the recipients side. It is impossible to access or read all the information out there.
The need for automated techniques to cope with so much information has become very important. Automated techniques are needed to prioritize the information that a user is able to access (or that gets sent to her) so that the user can make effective use of her time to read the information that might be most relevant to her.
Collaborative filtering is a general approach to personalized
information filtering![]() .
Collaborative filtering automates the process of recommending items
to a user based upon the opinions of people with similar tastes.
In most cases, the filtering system determines which users have similar
tastes by using standard formulae for computing statistical correlations.
In other systems, users can additionally specify the users whose ratings
should be considered while computing the prediction.
.
Collaborative filtering automates the process of recommending items
to a user based upon the opinions of people with similar tastes.
In most cases, the filtering system determines which users have similar
tastes by using standard formulae for computing statistical correlations.
In other systems, users can additionally specify the users whose ratings
should be considered while computing the prediction.
Collaborative filtering has been present socially and implemented on a human level each time people have based their actions (for example, going for a particular movie) on the feedback received from people they normally agree with (for example, the opinion of a close friend or neighbor). Today's networked computers allow collaborative filtering to apply to more and more users. This technique helps a user build correlation with every other user depending on how much she agrees with them and then uses a combination of this correlation and their feedback on particular items to help her filter out or prioritize her items. Take the example of a user making a decision on the movie she wants to go and see. If there is a way for the user to find all the people who have similar tastes about movies, she could make a much better decision about the movie to see by basing her decision on the opinions of all these people instead of relying on the opinions of a few friends.
Many collaborative filtering techniques use a form of weighted average to determine a prediction for a user [BP98, , , FD92, ]. These techniques use the correlation (degree of similarity between two users) as the weights. Every user receives a prediction for all items and submits a rating of how well she likes a item after reading it. This feedback given by her is used along with similar feedback from other users to calculate a rating prediction. The feedback given by the user along with the rating prediction received by her for a particular item is later used to update her degree of correlation with every user.
The effectiveness of collaborative filtering techniques relies on the confidence on the computation of the ``similarity'' between users. Further, the more the number of ``similar'' users, the more effective the prediction will be as having more users can minimize the inconsistencies/errors that could arise if a user agreed with another on most topics except a few. For example, if user A agreed on most things with user B except that user A liked romantic comedies and B hated them, then it would lead to an inaccurate prediction if A relied only on user B's rating for romantic comedies. We shall henceforth refer to improvements suggested to current collaborative filtering techniques to improve the accuracy of the predictions as tuning of collaborative filtering techniques.
Current collaborative filtering techniques make predictions without taking the history between users into account. These systems neither threshold on the history between users nor assign any weights to the history so that users with stronger histories can influence the prediction more than other users. A user is given a prediction based on the ratings of users who may not have seen enough items in common to be able to justify making a strong prediction based on their ratings. For example, if user A and B have seen only one item in common and have agreed, it is not a strong basis to predict that they will agree on the rating given to the second item, too. Current techniques also do not favor those people that have a strong history and cannot give more importance to ratings of users who have agreed over a larger number of articles and so are more likely to agree in the future. We shall henceforth refer to these issues as the History Problem.
Another reason for tuning is that current techniques make predictions even if the number of users (or raters) whose ratings are utilized are less than a particular threshold. For example, if an item has been seen by just one user, it could potentially be a ``weak'' rating. There is a possible risk of computing an inaccurate prediction for an article if only one user had rated it and the article happened to be on a subject that the user in question and the user who rated it disagreed on even though the two users had a high correlation over all topics. One way to solve this issue is to be able to let the system give a stronger prediction even if the number of people who have read the article and have a correlation with the user is low. This is possible if the system bases the prediction on the content of the article also. We shall henceforth refer to this issue as the Weak Rating Problem.
Furthermore, current collaborative filtering systems do not use the content of the article as a factor in determining its relevance. Predictions are entirely based on correlation between other users. If a user wants articles on ``collaborative filtering'' to be given a high prediction, she cannot specify that articles with particular content (in this case ``collaborative filtering'') be always given a higher rating. This means that a user cannot setup specific profiles so that articles with certain keywords would be given higher rating predictions by the system. She is also unable to specify just how much she wants the information content to control a rating prediction. For example, she may want items marked as at least average by other users and containing the words ``collaborative filtering'' to be given a higher prediction. Therefore, we also need to integrate current traditional content-based filtering techniques with collaborative filtering to provide a user with a more accurate prediction under all circumstances. We shall henceforth refer to this issue as Content Problem.
Lastly, tuning is also required for cases where current techniques provide predictions outside the range of valid ratings. Current collaborative filtering algorithms can face situations where the computed prediction falls outside the range of ratings that a user can give to an article. In such cases there is no clear definition of how to interpret these predictions that are above or below the valid range. For example, if a prediction of 7 is mapped to 5 (5 being the highest possible on a scale of 1 to 5), it is unclear how a user should interpret a prediction of 5 that was not re-mapped. This reduces the confidence that a user can place in a prediction. We shall henceforth refer to this issue as the Normalization Problem.
We implement modifications to current weighted average algorithms to solve the problems outlined above. We improve accuracies in predictions arising due to the History Problem by enforcing thresholds on the number of articles seen in common by any two users. Ratings of users who have seen articles less than the thresholds with the user in question are not considered for the computation of the prediction. We also impose similar thresholds on the correlation between two users so that only users who have very similar/dissimilar opinions influence the predictions. We evaluate our modifications to the basis algorithm on data sets extracted from the Eachmovie data set [EM97]. In addition, we analyze the characteristics of collaborative filtering data sets.
We devise techniques for content filtering of the news articles and for the integration of the collaborative and content filtering predictions. In order to evaluate our approach to the content problem, we built a filtering system that combines collaborative and content based filtering on newspaper articles from a local online newspaper (Telegram and Gazette). We ran this system with a test bed of 18 users who rated newspaper articles for two months and collected and analyzed performance data.
In summary, the main contributions of our work are:
In Chapter 2, we look at related work in information filtering in general and collaborative filtering specifically. In Chapter 3, we discuss the various improvements we propose to the base algorithm and our experiments to evaluate our improvements. In Chapter 4, we discuss our approach to integrating collaborative filtering techniques with content based filtering techniques and our experiments to evaluate our aproach. Lastly, we present our conclusions in Chapter 6 and recommend areas for future work in Chapter 7.
The general problems of information overload have received considerable attention in research literature. Research in the general area of solving information overload problem can be broadly categorized into information filtering techniques and information retrieval. We shall use the term information filtering generically to refer both to finding desired information (filtering in) and eliminating that which is undesirable (filtering out).
Malone et al. describe three categories of filtering techniques, cognitive, social, and economic, based on the information sources the techniques draw on in order to predict a user's reaction to an article [MGT87]. The three categories provide a useful road map to other literature on filtering techniques. In the recent past, work has also been done on systems that use a combination of any two or all three of the above categories. We shall refer to these as hybrid techniques and shall discuss some of the work done in this area.
Cognitive, or content-based, filtering techniques select documents based on the text in them. For example, the kill files and string search features provided by Usenet news clients perform content filtering. More sophisticated techniques might also filter out articles from people who previously co-authored papers with an objectionable person. Even the division of Usenet news into newsgroups is a primitive example, since a reader restricts her attention to those articles with a particular text string in their ``newsgroup:'' field. Strings could also be combined with the Boolean operators AND, OR, and NOT.
Alternatively, the profile of what to filter in or filter out could consist of weight vectors, with the weights expressing the relative importance of each of a set of terms [DDF90, FD92, PR91]. In standard ``keyword-matching'' vector systems [PS79], textual databases are represented by a ``word-by-document'' matrix whose entries represent the frequency of occurrence of a word in a document. The similarity between documents is computed as the inner product or cosine of the corresponding two columns of the word-by-document matrix. The words are considered to be pairwise independent.
Latent Semantic Indexing(LSI) [DDF90, ] does not consider the words to be pairwise independent. In LSI, the associations among terms and documents are calculated and exploited in retrieval. A description of terms, documents, and user queries based on the underlying latent semantic structure is maintained. Users can thus retrieve relevant documents even if they do not have any words in common with the query.
Some content filtering techniques update user profiles automatically based on feedback about whether the user likes the articles that the current profile selects. Information retrieval research refers to this process as relevance feedback [SB98]. It has been shown that user inputs about concepts related to those mentioned in an initial query, together with their relative importance, can significantly improve retrieval effectiveness [SB98]. Relevance feedback can be improved if users select features from the texts of relevant documents [CD90], instead of limiting them to selecting concepts from lists of terms selected automatically from relevant documents by the system (the system extracts these concepts by applying natural language processing techniques to the descriptions of interests that the user provides). The techniques for updating profiles can draw on Bayesian probability [BC92], genetic algorithms [SB90], or other machine learning techniques.
Social filtering techniques select articles based on relationships between people and on their subjective judgments. A moderated newsgroup employs a primitive form of social filtering, choosing articles for all potential readers based on evaluations by a single person, the moderator. Collaborative filtering, based on the subjective evaluations of other readers, is an even more promising form of social filtering. Human readers do not share computers' difficulties with synonymy and context when judging the relevance of text. Moreover, items being filtered need not be amenable to parsing by a computer. People can judge texts on other dimensions such as quality, authoritativeness, or respectfulness.
The Tapestry system makes more sophisticated use of subjective evaluations [HHWM92b]. In Tapestry, many people can post evaluations, not just a single moderator, and readers can choose which evaluators to pay attention to. Moreover, filters can combine content-based criteria and subjective evaluations. For example, a reader could request recipes containing the words ``romantic comedies'' that user B has evaluated and where the evaluation contains the word ``good''. Tapestry, though, does not include aggregate predictions.
The subjective evaluations used in collaborative filtering may be implicit rather than explicit. Read Wear and Edit Wear guides users based on other users' interactions with an artifact [HHWM92a]. This is done by associating the history of their use with computer documents. This is called the ``wear'' of an article/object. Objects with more wear are the more commonly used articles. Further, the wear acts as an indicator of the content of the article. PHOAKS another system based on Usenet news articles uses recommendations. This system searches newsgroups for any mention of web pages and then uses that information for assisting users on an information hunt [THA97]. PHOAKS provides a ranked list of articles where the highest ranked articles are predicted to be the most preferred.
The user modeling community has spawned a range of recommendation systems which use information about a user to assign that user to one of a finite set of hand-built, predefined user classes or stereotypes. Based on the stereotype that a user belongs to, the system then makes recommendations to the user. For example, [Ric79] recommends novels to users based on a stereotype classification.
The Grouplens [RIS94] system applies social information filtering to the personalized selection of NetNews. Grouplens employs Pearson's r correlation coefficient (a measure of the inherent strength of the relationship between two sets of values) to determine the similarity between users. The GroupLens news clients also monitor how long users spend reading each article to get an implicit rating reflecting how much a user likes an article. Finally, some commercial packages exist that make recommendations to users. An example is Movie Select, a movie recommendation software package by Paramount Interactive Inc. Some of the other movie recommendation systems are Movie Critic, moviefinder and Morse. These systems collect correlations between different items and use these to make recommendations. Another system that makes recommendations is the Sepia Video Guide by Sepia Technologies Inc. Bostondine, another recommendation system by Hubnet Communication Ltd. recommends restaurants in Boston that fit a user's tastes. Firefly and NetShepard Rating Services have tools for rating and filtering Internet content. Some ``customized newspapers'' developed by using cognitive filtering techniques are LA Times, London Times, CRAYON etc. An ongoing MQP at WPI is building a system to develop an on-line newspaper (Tango) using social filtering techniques [MSNM99].
Economic filtering techniques select articles based on the costs and benefits of producing and reading them. For example, Malone argues that mass mailings have a low production cost per addressee and should therefore be given lower priority [MGT87]. Applying this idea to Usenet news, a news client might filter out articles that had been cross-posted to several newsgroups. More complicated schemes could provide payments (in real money or reputation points) to readers to consider articles and payments to producers based on how much the readers liked the articles.
Stodolsky has proposed a scheme that combines social and economic filtering techniques [She94]. He proposes on-line publications where the publication decision ultimately rests with the author. During a preliminary publication period, other readers may post ratings of the article. The author may then withdraw the article, to avoid the cost to her reputation of publishing an article that is disliked.
The Fab system is a hybrid of the cognitive and social filtering techniques discussed above [BS97]. Fab maintains user profiles based on content analysis and directly compares the profiles to determine similar users for collaborative recommendation. Users ``receive'' items both when they score highly against their own profile or when they are highly rated by a user with a similar profile.
The Ringo system is similar to [BS97] except that during a similarity assessment between users, the system selects profiles of users with the highest correlation with an individual user [UP95]. The Ringo system uses mean-squared difference (a measure of the variance of articles) and the Pearson- R measure (a measure of the inherent strength of the relationship between two sets of values) to determine similarity.
Another System [BHC98] also combines social and cognitive filtering techniques by defining additional features about the articles (For e.g. some features of a movie could be the the actors, directors, writers etc. of the movie). These features along with the proportion of a retrieved set of documents that are relevant (called precision) and the proportion of all relevant documents retrieved (called recall) are then used to categorize the articles by degree of likability for users. Correlations with actual users are not used in this system.
[SKB99] use filtering agents (filterbots) that act like normal users in a collaborative filtering system. These filterbots return ratings on articles based on certain semantic information. This system used filterbots that generated ratings depending on the length of the article, the correctness of spellings in the article etc.
The tech report by Microsoft Research compares the various collaborative filtering techniques and performs an empirical analysis on the same [BHK].
Conventional information retrieval (IR) [SM83] is very closely related to information filtering in that they both have the same goal of retrieving information relevant to what a user wants while minimizing the amount of irrelevant information retrieved [SM83, vR79]. Selective Dissemination of Information (SDI), one of the original information retrieval systems, is similar to most information filtering applications [PS79, HK70]. SDI was designed as an automatic way of keeping scientists informed of new documents published in their areas of specialization. SDI maintained keyword based profiles of users and used these profiles to match the keywords against new articles to predict which of the articles would be most relevant to the scientist's interests. Furthermore, research done in the field of evaluation of IR techniques [SM83, ] can also be applied to information filtering systems. A number of measures of evaluating IR techniques have been developed with the best known being precision and recall described above. These measures can also adequately evaluate the effectiveness of most information filtering techniques. Further, Belkin and Croft identify the primary differences between information filtering and retrieval [BC92]. This will help researchers in the area of information filtering to benefit from research in IR, by ``customizing'' the IR techniques for information filtering while keeping in mind the differences between them. These differences mainly arise because user preferences in information filtering typically represent long term interests while queries in IR represent a short term interest that can be satisfied by performing the retrieval. Also, information filtering is typically applied to streams of incoming data while in IR, changes to the information source do not occur often and retrieval is not limited to new items in the information source. Finally, filtering involves the process of ``removing'' data from the stream while IR involves the process of ``finding'' information in that stream.
In pure cognitive filtering techniques, only a very limited analysis of the content can be performed. Only certain aspects of the text can be evaluated and other aspects like aesthetic quality of multimedia information, style of language of text, other computer non-scannable information like the network factors (e.g. loading time )are completely ignored. Also filtering of items that do not match a profile effectively inhibits the user from being able to see articles on new topics (outside her profile) thus narrowing the scope of articles she sees. On the other hand, social filtering techniques suffer from ``first user'' problems. A new article coming in cannot be recommended to a user until it has been read by at least one person. Also sparsity of coverage of ratings (in situations where the number of users is very small compared to the volume of data) can lead to inaccurate recommendations. Finally, users with tastes dissimilar to other users are ``punished'' as there will be very few users having a high correlation with such users. These can lead to filtering systems that are unable to give a prediction or filtering systems that are highly inaccurate.
We build upon past work in social and cognitive filtering techniques to combine the advantages of both.We shall make improvements to the social filtering techniques to minimize the effect of the above problems. We shall also integrate them with the cognitive filtering techniques to minimize some of the problems outlined above. We shall later propose techniques for the same.
We develop an algorithm to compute predictions that are more accurate (closer to the rating the user would give the movie) than those given by current algorithms. In this chapter we describe the basis algorithm, describe the general design and setup for experiments to evaluate our algorithms and explain our incremental improvements.
Although there is an increasingly strong demand for collaborative filtering techniques, only a few different algorithms have been proposed in the literature thus far [RIS94], [FD92], [MGT87], [Mal94], [Suc94], [BS97], [UP95]. Furthermore, most of these algorithms are based on simple predictive techniques that use a measure of agreement between users in order to make predictions. Like these previous researchers, we consider a collaborative filtering algorithm that uses a weighted average to compute predictions. We choose these algorithms not only because they constitute a large portion of the algorithms (including those used in commercial products) but also because they intuitively generate predictions for users based on the similarity between the interest profile of that user and those of other users. These algorithms compute the similarities (correlations) between user profiles or compute correlations between users by looking at their history of agreement over articles rated in common.
The basis algorithm defines correlation as a measure of the degree of like-mindedness between pairs of users. We define likability as a measure of how much the user will like/dislike the movie. It is the amount by which her rating would be above or below her mean. The mean, here, is an average over all the user's ratings. It gives an indication of how ``stringently'' or ``leniently'' the user rates items. The basis algorithm uses the Pearson's correlation coefficient to make full use of ratings between users that have different rating systems by adding the likability to the average rating the user gives her items to predict a rating for that particular user. For example, user A may rate all items between one to three where one is bad, two is average and three good while user B may rate all items between three and five where three is bad, four average and a five good. The algorithm adds the likability to the average of user A (two in this example) to predict a rating for user A.
The general formula to compute the likability for an article for a user by the basis algorithm is:
is the correlation of user i with the user for whom the prediction is being computed. represents the rating submitted by user i for the article for which the prediction is being computed. is the average rating (the average of all the ratings for all articles given by the user) for user i. is the total number of users in the system that have some correlation with user . These users are those whose ratings are used in the calculation of the prediction for user .
Consider an example to demonstrate how the formula is used to compute the prediction for an article for a user, X. The following table gives the ratings for an article by two users and their individual correlations with the user X. We assume that the mean rating for the user X is also known and equals 3 in this example.
| User A | User B Correlation |
Our basis algorithm considers ratings given by all the users for a particular article in order to calculate a prediction. This includes those users who have very low correlation between them. A Pearson's correlation coefficient in the range is considered to be a low correlation between users. Similarly or is considered a moderate correlation and and is considered a high correlation between any two users. Statistically, there is very little certainty that the ratings of users with low correlation between them follow either a pattern of similarity or dissimilarity. This suggests that the rating of such users then not be allowed to have a bearing on the calculation of the prediction. A contribution of this thesis is to improve the accuracy of the basis algorithm by implementing a threshold on the correlation such that only users with a correlation above the threshold will be able to affect the prediction calculated by the system.
We can also see that the basis algorithm can produce inaccurate results if the number of users whose ratings are considered are below a certain minimum. As an example, consider the case where two users A and B agree on most things except one topic. We would ideally not like to consider just user B's opinion to compute a prediction for user A for that particular topic (this is not handled by our basis algorithm). On the other hand, if there are a hundred users (including user B) who think like user A, then the rating of user B for that particular topic would not adversely affect the prediction as the rating of user B contributes a much smaller portion towards the computation of the prediction.
The history (number of items/articles rated in common between two users) should influence the prediction in some way. As an example, consider the scenario where user B has watched a hundred movies in common with user A and has always agreed with user A while user C has watched just one movie in common with user A but has agreed on that one movie. In this case we cannot really be sure about user A being in agreement with user C on the next movie. In fact the more movies user A watches in common with user C, and agrees, the greater the faith we have in the opinion of user C. There should be some way to differentiate between such users and give the rating of user B more weight than that of user C. We improve the accuracy of the basis algorithm by implementing thresholds on the history in common between two users.
In this section, we present experiments that evaluate our proposed improvements. We shall first describe the general experimental design. We focus on the techniques we use to calculate correlations between users and to compute a prediction for a particular article for a user. We then describe the experimental setup for our improvements focusing on how we compute the accuracy of a prediction.
The design for our experiments on the improvements to the basis algorithm will comprise of off-line experiments. This means that we do not perform these experiments on real users using a live system but instead perform these experiments on both data simulated by us and on data from previous collaborative filtering experiments. The simulated data consists of both random and pseudo-random data sets generated by us that simulate the ratings provided by users in a real system.
The off-line experiments mainly consist of experiments on the data
from the EachMovie![]() collaborative filtering service. The EachMovie service was part of a
research project at the Systems Research Center of Digital Equipment
Corporation. The service was available for 18 months from February 1996
to September 1997. During that time the database grew to a fairly
large size, containing ratings from 72,916 users for 1,628 movies. User
ratings were recorded on a numerical six point scale. The data set is
publicly available and can be obtained from the Digital Equipment
Corporation (now Compaq).
collaborative filtering service. The EachMovie service was part of a
research project at the Systems Research Center of Digital Equipment
Corporation. The service was available for 18 months from February 1996
to September 1997. During that time the database grew to a fairly
large size, containing ratings from 72,916 users for 1,628 movies. User
ratings were recorded on a numerical six point scale. The data set is
publicly available and can be obtained from the Digital Equipment
Corporation (now Compaq).
As a part of the off-line design we maintain separate files which store the ratings for different movies given by a user and the correlations between all pairs of users in the system. The ratings for the movies are extracted from the EachMovie data set. These ratings are stored as a matrix of users with ratings in a text file and are later used to generate correlations between users. The correlations between users are generated as Pearson's correlation coefficients. The system then uses these ratings and correlations and calculates the prediction for every movie for every user. The predictions are calculated using the formulae described in our individual improvements. This is done by ``pulling out'' the rating for the movie in question for a user. This means that when the system calculates the prediction for that movie for the user, it ``ignores'' the rating value for that specific instance from the matrix, thus simulating a condition where the user has not watched the movie earlier and therefore has given no rating for it. The prediction is then compared with the actual rating for the movie in question for that user (the value that was ``pulled out'' from the matrix during the computation of the prediction) to give an indication of the accuracy of the prediction. We describe this process in detail in the next section covering the experimental setup. This process is carried out for every movie for every user in the data set (for every point in the generated matrix) to get the average accuracy of the prediction for the data set.
We conduct similar experiments on random and pseudo random data. For these experiments, we generate random/pseudo random data to represent the ratings submitted by users for movies. All the other steps are the same as those carried out for the off-line experiments on the EachMovie data.
The accuracy of a prediction can be measured by determining the number and severity of errors. An error is the difference between the rating prediction supplied by the system and the rating given by the user. We test our algorithms by checking the variance and percentage of errors produced by our algorithm. An error is serious if the difference in the predicted rating and that given by the user after rating the item is very large while an error is trivial if the predicted rating value and the actual rating given by the user varies not more than one level so that rounding the prediction to the nearest level would not lead to any recognizable error by the user. The trivial errors are therefore a function of both the user interface used by the system and the scale of the ratings. If the acceptable range of ratings is the list of positive numbers between one to ten then an error of 0.3 for example might not get noticed by the user as the prediction will get truncated to the nearest integer. Consider the case where the rating given by a user was 5. If the system computed the prediction as a 4.7 (so that the error is 0.3) but rounded that off to 5 before showing it to the user then the user would not even notice an error if the prediction was shown as a number! On the other hand, if the user interface used a scroll bar to indicate the prediction then the error might have been more noticeable. As a second example, consider the situation where the system allows all positive numbers between one and hundred as valid ratings. In this case an error of 0.3 by the system would be less noticeable even on the scrollbar user interface! We use a 10 point scale to give ratings and predictions with all integers between 1 and 10 as valid ratings (or predictions).
A `good prediction' will have low deviation of the prediction from the actual rating. The metrics that we will use to measure the accuracy of our algorithms include the following:
In this section, we describe and test the individual improvements to our basis algorithm. We also analyze the results of these experiments.
The basis algorithm computes a prediction by using the ratings submitted by all the users of the system for the article in question. This includes the ratings submitted by users who have a low correlation with the user in question. This can lead to to inaccuracies in the prediction if the number of users with a low correlation increases or is more than the number of users with a high correlation with the user in question. The positive effect of the rating of like-minded users on the prediction will be negated (or overshadowed) by the ratings of users with low correlation with the user in question.
As an example, consider the case where user A has a high correlation (equal to 0.8) with user B but a low correlation (equal to 0.3) with users C, D and E. If user B gives a rating of 10 (on a scale of 1 to 10) for an article and users C, D and E give a rating of 2, 4 and 2 respectively then the prediction computed by taking all the users into consideration will be 5.47 which is closer to 4 than to 10. Intuition suggests that since user A generally agrees with user B than with the other users, hence the prediction for user A should reflect the rating given by user B more than the ratings given by the other users.
Another potential problem with using the ratings of all the users is that there is an increase in the computation time which is not justified by an equivalent increase in accuracy. Considering the ratings of all the users (irrespective of their correlation with the user in question) increases the computation time exponentially with an increase in the number of users. At the same time, this increase in computation time is not justified by a corresponding increase in the accuracy of the prediction. In fact, as we can see from the example above, the accuracy can potentially drop!
To address this problem, we implement thresholds on the correlations with users that are to be considered. For example, if we had only taken the ratings of users above a certain threshold (say 0.5) then we would have been guaranteed a prediction that was closer to user B than to the other users. We consider only those users that have a high correlation with the user in question thus reducing the margin of error. The advantage with this technique is that users with lower correlation do not unduly affect the rating prediction and the prediction is based only on those users who show either a high degree of agreement or disagreement.
The specific implementation of this improvement is as follows:
We carried out off-line experiments on data extracted from the EachMovie database [EM97]. Data sets were created by extracting the ratings submitted by a subsection of the users on various movies. In order to obtain a broad range of correlations between users. These ratings were then stored as matrices with each element in the matrix (dataset) representing the rating submitted by a user for a particular movie, . We generated the prediction for every user for every movie. This was done by ignoring the element (rating) in the matrix for that particular user and movie. We then considered the ratings submitted by other users for the movie in question. We note that for this improvement we only considered users who have a correlation above the threshold with the user in question. We compared the prediction computed as above with the rating (extracted from the EachMovie data) that the user gave for the movie. We repeated this same procedure for every user and movie (for every data element in the matrix data set). We computed the average absolute inaccuracy (absolute difference between the generated rating and its computed prediction) for the whole data set. This is the average inaccuracy of the data set for that particular value of the correlation threshold. We then repeated the same procedure for different values of the correlation threshold.
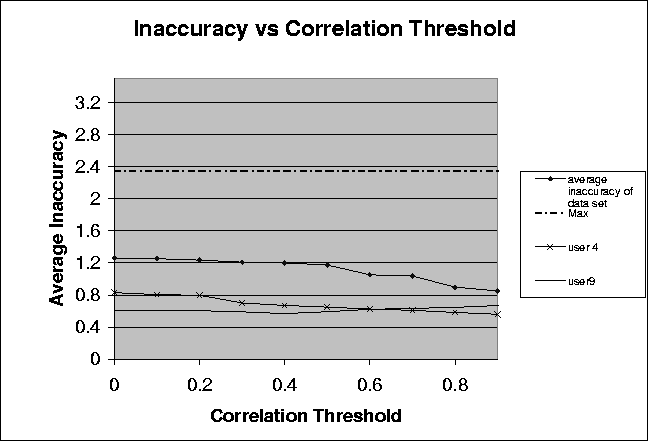
Figure: Plot showing the relationship between the average inaccuracy and the correlation threshold for data from the EachMovie Data. This dataset consists of the ratings of 58 users and 125 movies. Average inaccuracy is an average of the differences between the rating and the prediction for every pair of users and movies in the data set.
Figure 3.1 illustrates the results from our experiments on a data set consisting of ratings submitted by 58 users for 125 movies. The ratings in the data set are extracted from the EachMovie data. The ratings submitted were on a scale of 1 to ten. The line labeled Max shows the average of the of all the users in the data set. This is computed by taking the average of the inaccuracies in the prediction returned for all the users if the prediction returned was the mean rating of the user. We plot this as this is the prediction returned for the user if no user in the data set has a correlation higher than the threshold with the user in question. The line labeled average inaccuracy of data set shows the average inaccuracy for the data set for the corresponding correlation threshold value. The average inaccuracy was calculated by taking the average of inaccuracies in all the predictions computed by the system for every pair of users and ratings. The lines labeled user1 and user9 show the average inaccuracy in the predictions for individual users. This is computed by taking the average of the inaccuracies in the predictions for all the movies for that particular user.
We can see from the graph that the mean rating of the data set (Max) is always higher than the average inaccuracy of the data set for all values of the threshold. As discussed earlier, we know that the mean is the prediction returned by the system when the number of users with a correlation above the threshold with the user in question is zero. This means that the prediction returns a mean when the ratings of other users are not considered at all (collaborative filtering techniques are not applied). This value is above the average inaccuracy of the data set even when no thresholds are applied. Using collaborative filtering techniques, therefore, is better than just returning the mean as the prediction.
The curve labeled average inaccuracy of data set shows the average inaccuracy of the data set for different correlation thresholds. The average inaccuracy of the data set drops with increasing values of correlation thresholds. This is because at each correlation threshold, the rating of the users who have a value less than the correlation threshold are not considered. We are thus increasingly considering only those users whom we agree with the most. This implies that the application of correlation thresholds leads to increased accuracy of the predictions.
Lines labeled user1 and user9 show the average inaccuracies for two different users in the data sets. We can see that the accuracy of the prediction for the user in Line user1 benefits all the time from the application of correlation thresholds. This implies that the correlation threshold of 1.0 (considering only those users whom the user in line 3 always agrees with) is the best choice. Line user9, on the other hand, shows that the average inaccuracy for that user decreases upto a certain value of the threshold but then increases if the correlation threshold value is further increased. Though application of correlation thresholds is beneficial for the user in line user9, the value of the best threshold for the user in line user9 is not the same as that for the user in line user1 (which is the same as the best threshold value for the average inaccuracy of the complete data set). There is no correlation threshold that works best for all the users in the data set. Correlation thresholds should be different for different users to be able to compute the best predictions. The best correlation threshold value is most likely influenced by the number of users who are above this correlation threshold value. In particular, the inaccuracy increases with increasing correlation thresholds if the number of users who have a correlation above the threshold value drops below a certain number. However, the number of users varies from 40 to 49 and is not the same for each individual user.
We also carried out off-line experiments on random data sets. We generated random data sets as matrices by using a pseudo-random number generator to generate the ratings submitted by users for different movies. We performed experiments similar to those on the EachMovie data. The graph shown below illustrates the relationship of the inaccuracy of the prediction and the correlation threshold value.
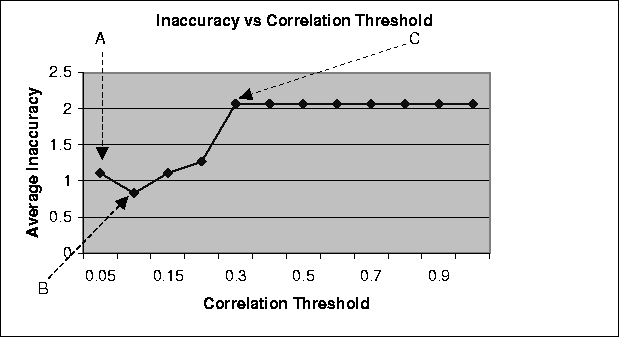
Figure: Plot showing the relationship between the average inaccuracy and the correlation threshold for a random data set consisting of 10 users and 100 movies. Average inaccuracy is an average of the differences between the rating and the prediction for every pair of users and movies in the data set.
Figure 3.2 illustrates the results from our experiments on a data set consisting of ratings submitted by 10 users for 100 movies. The ratings submitted were on a scale of 1 to ten. The average inaccuracy plotted in the graph is the average inaccuracy for the data set for the corresponding correlation threshold value. The average inaccuracy was calculated by taking the average of inaccuracies in all the predictions computed by the system for every pair of users and ratings.
Point A on the curve shows the average inaccuracy when there is no correlation threshold applied (correlation threshold is 0.0). Point B on the graph shows the average inaccuracy when the correlation threshold is 0.1. Point C shows a rise in the inaccuracy when the correlation threshold is increased to 0.3.
Figure 3.3 also illustrates the relationship between the average inaccuracy of the data set and the correlation threshold. This graph illustrates the results of the same experiment (with correlation thresholds) on a random data set with the same number of users but a greater number of movies (five times the number of movies as in the first graph).
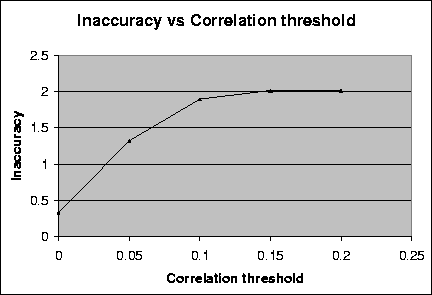
Figure: Plot showing the relationship between the average inaccuracy and the correlation threshold for a random data set consisting of 10 users and 500 movies. Average inaccuracy is an average of the differences between the rating and the prediction for every pair of user and movie in the data set.
We can see from the above graphs that the use of random data to test for collaborative filtering techniques is not very useful. The inherent randomness of the data generated does not loan itself to computations of correlations or the predictions made using the correlations. We make the following general observations:
We shall henceforth perform all our off-line tests only on data from the EachMovie data set [EM97].
Typical collaborative filtering algorithms also use the ratings submitted by users who have a low history with the user in question. This means that the algorithms also consider the ratings of users who have rated a low number of items in common with the user for whom the prediction is being calculated. This can lead to inaccuracies in the prediction computed by the system if the number of users with a lower history with the user in question increases or is more than the number of users with a high history with the user in question. There is no statistical basis for a prediction if the history of agreement is low. For example 2 movies watched in common and liked by both users does not guarantee or even strongly indicate that the two users would agree on the next movie. A prediction based on the opinions of users with low history is likely to be inaccurate. The positive effect of the rating of users with a high history on the prediction could be negated by the ratings of users with low history with the user in question.
As an example, consider the case where user A has a high history (two thousand movies watched in common) with user B but a low history (two movies watched in common) with users C, D and E. Assume also, for the example, that user A has the same correlation with all the users such that user A has a correlation of 1.0 with users B, C, D and E. If user B gives a rating of 10 (on a scale of 1 to 10) for an movie and users C, D and E give a rating of 2, 4 and 2 respectively then the prediction computed by taking all the users into consideration will be closer to 4 than to 10. Since user A has agreed all the time with user B for a range of two thousand movies it is more logical to say that user A and user B think alike and so the prediction for user A should be closer to the rating given by user B. On the other hand, we can see that since users C, D and E have not watched many movies in common with user A, a high correlation with user A does not always guarantee a proven history of agreement between user A and users C, D and E. We therefore cannot really justify making a strong prediction based on their ratings.
We tune our basis algorithm such that the weighted average formula for the computation of the prediction is applied only to users who have rated more items in common than the history threshold. We implement history thresholds such that we consider the correlation and the rating given by each user only for users who have the number of items rated in common greater than the history threshold imposed by the system. We carry out our experiments on different values of history thresholds.
In our example, if we had only taken the ratings of users above a certain threshold (say 50 movies watched in common) then we would have been guaranteed a prediction that was closer to user B than to the other users. We consider only those users that have a high history with the user in question thus reducing the margin of error. The advantage with this technique is that users with lower history do not unduly affect the rating prediction and the prediction is based only on those users who show either a proven degree of agreement or disagreement.
The specific implementation of this improvement is as follows:
We carried out off-line experiments on data extracted from the EachMovie database by extracting the ratings for various movies for a number of users such that each element in the matrix (dataset) represented the rating submitted by a particular user for a particular movie. We note that since the EachMovie database is very sparse (with a density of ratings of only about 2 percent) we had to limit our choice of users and movies that we used in the data set such that the users submitting more ratings and movies for which more ratings had been submitted were selected over others. This was done to ensure that most users had at least two movies in common with some other user. (This is necessary for the system to be able to compute a correlation between the two users). We also had to ensure that the users and movies were selected such that at least some users had a history in common (movies watched in common with each other) greater than the history threshold value so that the system could compute the prediction for all the history thresholds in the experiments.
We generated the prediction for every user for every movie that the user had watched and submitted a rating for. We performed experiments similar to those for the correlation thresholds improvement. The graph shown below illustrates the relationship of the inaccuracy of the prediction and the number of users in the data set for data extracted from the EachMovie database [EM97].
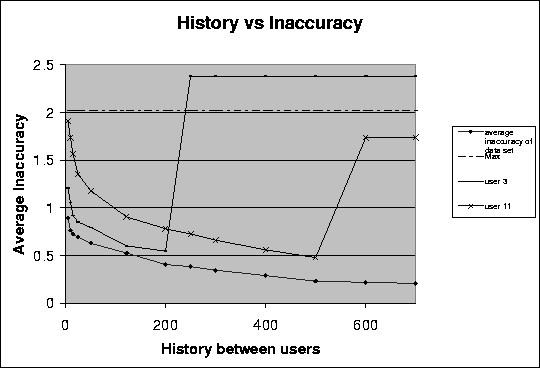
Figure: Average inaccuracy and the history in common between any two users. The number of users is kept constant at 125. Average inaccuracy is an average of the differences between the rating and the prediction for every pair of users and movies in the data set.
Figure 3.4 illustrates the results from our experiments on a data set consisting of ratings submitted by fifty eight users for six hundred movies. The ratings in the data set are extracted from the EachMovie data. The ratings submitted were on a scale of 1 to ten. The line labeled Max shows the average of the of the data set. This is computed by taking the average of the inaccuracies in the prediction if the prediction returned was the same as the user's mean rating value. We plot this as this is the prediction returned for the user if no user in the data set has a history in common higher than threshold with the user in question. Line average inaccuracy of data set shows the average inaccuracy for the data set for the corresponding history threshold value. The average inaccuracy was calculated by taking the average of inaccuracies in all the predictions computed by the system for every pair of users and ratings. Lines user 3 and user 11 show the average inaccuracy in the predictions for individual users. This is computed by taking the average of the inaccuracies in the predictions for all the movies for that particular user.
We can see from the graph that the mean rating of the data set (Max) is always higher than the average inaccuracy of the data set for all values of the threshold. As discussed earlier, we know that the mean is the prediction returned by the system when the number of users with a history in common above the threshold with the user in question is zero. This means that the prediction returns a mean when the ratings of other users are not considered at all (collaborative filtering techniques are not applied).
The line labeled average inaccuracy of data set shows the average inaccuracy of the data set for different history thresholds. We can see that the average inaccuracy of the data set drops with increasing values of history thresholds. This is because at each correlation threshold, the rating of the users who have a value less than the history threshold are not considered. We are thus increasingly considering only those users whom we have watched the most movies in common with. This implies that the application of history thresholds lead to increased accuracy of the predictions.
Lines user 3 and user 11 show the average inaccuracies for two different users in the data sets. We can see that the accuracy of the prediction for the user in line user 3 benefits from the application of correlation thresholds upto a certain value. The history threshold of 200 (considering only those users with whom the user in line user 3 has watched at least 200 movies in common) results in the maximum accuracy. Line user 11, on the other hand, shows that the average inaccuracy for that user decreases upto a certain value of the threshold but then increases if the history threshold value is further increased. Though application of history thresholds is beneficial for the user in line user 11, the value of the best threshold for the user in line user 11 is not the same as that for the user in line user 3. There is, thus, no history threshold that works best for all the users in the data set. The history thresholds, therefore, should be different for different users to be able to compute the best predictions. We plotted the average inaccuracy for other users as well and made similar observations in the trends about the inaccuracy and the best history thresholds for individual users.
We also observed that the optimum correlation threshold value depends on the number of users who are above this history threshold value. In particular, the inaccuracy increases with increasing correlation thresholds if the number of users who have a history in common above the threshold value dropped below a certain number. This number of users, however, is not the same for all users and varies between 35 to 50.
As we mentioned earlier, we also believe that the ``strength'' of predictions computed by considering users who have a low history in common with the user in question would be low. For example, consider a situation where user A and user B have watched just two movies in common and have agreed on both. There is no statistical justification in assuming that they will think alike on the next they watch (i.e. the prediction is inherently weak). On the other hand, if user A and user B had watched two thousand movies in common and agreed on all then they are likely to agree on the next movie they watch.
We have also discussed earlier that predictions computed by using the ratings of users who have a low history also leads to predictions that are not consistently accurate. The history between users is not high enough to guarantee that the correlation computed between these users is a true indication of their degree of similarity or dissimilarity. We would thus assume that such predictions would have a high standard deviation. (This has been discussed in more detail earlier in section 3.2.2).
We perform analysis on the data from the above experiments to see the effect of the history on the strength of the prediction. We compute the standard deviation of the inaccuracies in the predictions. We then plot the average inaccuracy of the data set and also plot graphs which are at 1 standard deviation distance from the average. (For normally distributed data approximately 60 percent of the total predictions would lie in the range within 1 standard deviation of the mean.
The graph shown below illustrates the relationship of the inaccuracy as well as the standard deviation of the inaccuracy of the prediction and the history in common between the users in the data set for data extracted from the EachMovie database.
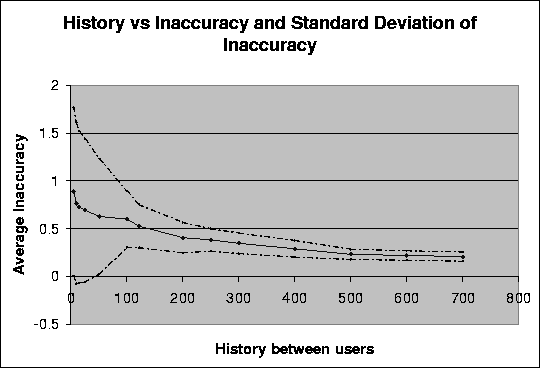
Figure: Plot showing the relationship between the average inaccuracy, the standard deviation of the average inaccuracy and the history in common between any two users in the data set for a data set consisting of ratings extracted from the EachMovie database. Average inaccuracy is an average of the differences between the rating and the prediction for every pair of user and movie in the data set.
We observe in figure 3.5 that the standard deviation is really high for a history in common of five movies and then rapidly drops with an increase in the history in common between users. This supports our earlier conclusion that an increase in the history in common between any two users will lead to predictions that are not just more accurate but also more consistently accurate.
A potential problem with the basis algorithm is that the rating prediction computed by the system for a particular article for a user could be outside the valid range for the rating. This means that if the ratings given by the user are on a scale of 1 to ten, then the prediction could be either greater than 10 or less than 1 for some cases. This can potentially lead to problems of interpretation of a prediction. For example, if the system sometimes returns a prediction of 12 (while the allowed range of valid ratings is between 1 to ten) it will be forced to represent this prediction of 12 as a 10 as that is the maximum possible in the range. This leads to questions about the confidence a user can place in a prediction computed by the collaborative filtering system as she has no guarantee that if a prediction of 12 should be taken as a 10 then a prediction of 10 for example should still be taken as a 10 (since this is in the valid range and the system does not have to ``round'' it off as in the previous case) and not as a 8.
We try and reduce the effects of this problem by normalizing the likability so that the final rating prediction is always between the minimum and maximum rating values. This allows us to convert the prediction value calculated into an accurate measure of the likability of a movie.
The specific improvement is as follows:
We carried out various experiments using both random and pseudo-random data sets and the data from the EachMovie database. We also carried out various tests and computed the predictions on all combinations of movies and users for varying data sets. These predictions were computed for data sets of varying sizes and shapes (ratio between number of users and movies watched by users in a data set). We found, however, that though such a situation (of obtaining predictions above or below the valid range of ratings) can be theoretically possible, it never happened in all our tests. We conclude that this ``improvement'' need not be implemented with the intent of improving the quality of the prediction.
In this chapter, we describe the motivation for an integration of content and collaborative filtering techniques. We also describe the content filtering algorithm and its various pieces. We implement content based filtering using a keyword matching technique. In the following sub-sections we shall talk about the techniques we use for key-word generation and matching and their application to the user profile in our content-based filter.
The results from figure 3.3 suggest that collaborative filtering by itself cannot always guarantee a good prediction. On the contrary, the inaccuracy can increase if the number of people who have a correlation with the user in question is very low. In particular, figures 3.1, 3.2 and 3.3 suggest that correlation thresholds selected for a data set produce more accurate predictions as long as the number of users which have a correlation above this threshold with the user in question is above a certain limit.
We performed experiments to observe the effect of the number of users on the average inaccuracy of a data set. We have seen earlier in figures 3.2 and 3.3 that the average inaccuracy of the data set (when correlation threshold is zero) decreases when there is a corresponding increase in the number of users. We also note that this was not observed for higher correlations as the number of users above higher correlation thresholds in the second data set were very few. This lack of enough users above a correlation threshold was unavoidable due to the nature of randomly generated data sets.
We therefore used the ratings from the EachMovie data set to perform our experiments [EM97]. We also note, that for the purpose of our experiments on user thresholds we kept the number of articles in the data set constant.
The specific implementation of this experiment is as follows:
We used data from the EachMovie data set and performed experiments similar to those defined in chapter 3. These experiments were then repeated for a similar data set extracted from the EachMovie database but with increasing number of users in the data set, keeping the articles in all the data sets constant. We carried out experiments with the number of users varying from five to six hundred.
The graph shown in figure 4.1 illustrates the relationship of the inaccuracy of the prediction and the number of users in the data set for data extracted from the EachMovie database.
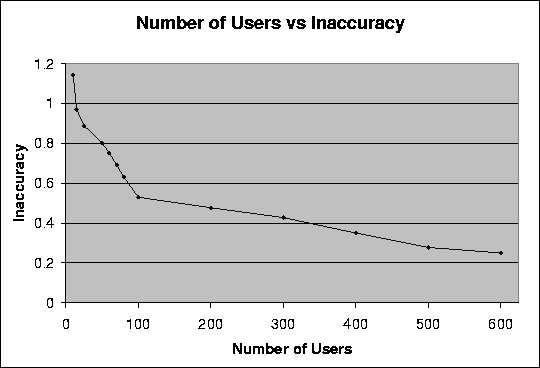
Figure: Plot showing the relationship between the average inaccuracy and the number of users in the data set for a data set consisting of ratings extracted from the EachMovie database. The number of articles is kept constant at 125. Average inaccuracy is an average of the differences between the rating and the prediction for every pair of users and movies in the data set.
The EachMovie data has been described in more detail earlier in section 3.3.1.
We observe in figure 4.1 that the inaccuracy drops with an increase in the number of users. We also note that the inaccuracy in the data set drops more rapidly in the first part of the graph when the number of users increases from 5 to a 100. As we can see there is a rapid decrease in the inaccuracy in the first part of the graph (till the number of users equals 100). We believe this is due to the fact that in the beginning the number of users is very few and therefore there is a greater chance of error if the users have a low correlation. This error could also occur even if they have a generally high correlation but if they disagree on that topic with the user in question. As there are very few users in the system, the contribution of each user's rating towards the final computed prediction is high and therefore can lead to a higher inaccuracy in the prediction. We note that the the decrease in inaccuracy is much slower in the interval when the number of users increases from 100 to 600. We believe this is because of two reasons. First, the number of users is large and so the prediction is fairly accurate. A further increase in the number of users (from 100 to 600) does not significantly improve the prediction. Second, as the number of users in the data sets is large, the contribution that a single user makes to the prediction is small. So cases where two users have a high aggregate correlation but disagree on the subject of the article in question does not lead to significant inaccuracies in the prediction. The negative effect of such cases on the prediction is reduced as the number of users is large and therefore any one user does not significantly influence the prediction.
Figure 4.1 shows that collaborative filtering works better on data sets with larger numbers of users. It also shows that when the number of users in the data set is small the inaccuracy in the prediction computed by the collaborative filtering techniques is higher.
We have just seen that one disadvantage with pure collaborative filtering techniques is that predictions computed can be very inaccurate in the beginning stages when the number of users and articles rated by users is low. In some cases, the collaborative filtering systems may not even be able to compute the prediction. A user has to have rated at least two articles in common with another user for the system to be able to compute a correlation between them. In the beginning stages of the collaborative filtering system, the number of articles rated in common between any two pair of users is very low (Collaborative filtering systems can be very sparsely populated). This can lead to situations where the system may not be able to compute a prediction at all or will compute the prediction based on the ratings of very few users making it highly prone to inaccuracies.
Also even if two users have a high correlation between them, they may not agree on particular topics. A user may want to see items on certain topics irrespective of the opinions of other users.
All the above observation suggest that pure collaborative filtering techniques are not sufficient and there is a need to make them more accurate. We suggest using content based filtering techniques in conjunction with pure collaborative filtering techniques to improve them.
In the following sections, we shall describe the content filtering algorithm and the integration of content and collaborative filtering techniques proposed by us.
We implement the content based algorithm using a keyword matching technique that relies on the significant words of the article and the user specified profile. We shall, therefore, first briefly describe the format of the user's profile required for the calculation of the content based prediction.
The user's profile is setup as follows. Each profile is divided into sections that the information source is divided into. These sections can ideally correspond to newsgroups if the prediction is for a Usenet News system, to the various sections that a newspaper is divided into or the various categories that web sites are divided into (for example the various categories which the users of AOL can choose to explore when they first log in). We develop a system that uses newspaper articles to perform experiments on the content filtering algorithm. We shall discuss the specific design of this system in later sections. We divide the profile of users into sections of a newspaper as we use a collaborative filtering system for a newspaper to test our integration of collaborative filtering with content based filtering. In this case for example, each profile will have sections like sports, world news etc. A user can choose to be shown articles belonging to particular sections. This is done by clicking on the checkbox for that particular section. For example, if a user chooses sports but does not choose world news then this implies that the user wants the system to compute higher predictions for articles under the sports section and not to articles under the world news section. In addition, a user can specify keywords for any section. Articles containing these keywords get a higher weight by the system. So if the user specifies basketball as a keyword in the sports section then sports articles on basketball should be given higher weight than other sports articles.
In addition to the profile setup by the user (also called the explicit profile), each user also has a set of implicit keywords that the system assigns. This list of keywords is populated by appending the keywords of the articles that the user has given a higher rating to the pre-existing list of implicit keywords. This list is a continuously changing and growing list. For example, if the user has given a rating of 10 (on a scale of 1 to 10) then all the keywords extracted from the article will be appended to the user's list of implicit keywords. This list, therefore, acts as an indicator of what the user has liked in the past.
We can see from the above description that even if the user specifies no keywords but selects a section, the system should still be able to use that information to give some feedback on how well he would like a particular article. Specifying keywords can lead to a stronger and more confident prediction on the likability of the articles. It would thus be more beneficial if the articles liked by the user in the past can also be used by the system to give a higher rating for articles that are similar (in our case, containing similar keywords) to those which the user gave a higher rating. This becomes more significant when we consider the fact that some users may not be able to give explicit keywords to describe their choices.
This implies that the system should consist of three parts and then combine them at the end. The three parts we refer to are:
Until conclusively proven otherwise, we shall treat them all equally (we shall assign equal weights to them during the computation of the content based score).
As mentioned earlier, we base our algorithm for content based filtering on the technique of keyword matching to determine how close the article matches the user's keywords. Since the aim of this research is just to explore the effect of integrating content based filtering techniques with pure collaborative filtering and to design a way to implement the same, we feel it is sufficient to implement a simple content based filtering algorithm like keyword matching. We base our algorithm on the technique proposed by Luhn which states that the frequency of occurrence of words in an article furnishes a useful measurement of word significance [Luh58]. Let f be the occurrence of various words in a text and r their rank order, that is, the order of their frequency of occurrence. A plot relating f and r yields a curve similar to the hyperbolic in figure 4.2. This is in fact a curve demonstrating Zipf's Law [Zip49] which states that the product of the frequency of words and the rank order is approximately constant. Zipf verified his law on American Newspaper English. Luhn used this as a hypothesis to enable him to specify two cut-offs, an upper and a lower (see figure 2.1), thus excluding non-significant words. The words exceeding the upper cut-off are considered to be common and those below the lower cut-off rare, and therefore not contributing significantly to the content of the article.
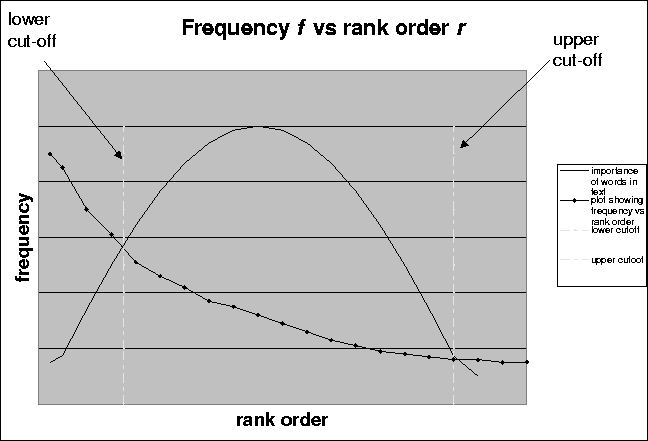
Figure: Plot showing the relationship of the frequency of a word in an article and its rank order determining its importance in the article.
Edmundson and Wyllys generalized Luhn's work by normalizing his measurements with respect to the frequency and of occurrence of general words in a text [HE61]. They thus devised a counting technique for finding significant words. Consistent with this, they assumed that the resolving power of significant words, by which he meant ability of words to discriminate content, reached a peak at a rank order position half way between the cut-offs and fell off from the peak in either direction reducing to almost zero at the cut-offs. Luhn, though, gave no values of these cut-offs. We suspect that this is because the cut-off values vary with information domains and document/article types. For our purpose, we shall fix these cut-offs for our experiments at one-fourth and three-fourths of the rank order. We can then use the words between these cut-offs as keywords for the article.
We note that just applying the above technique in a straightforward manner to the words of an article can lead to errors. Different forms of the same words (e.g. factual, facts, fact) are considered as different words by the system during the determination of frequency of occurrence. For example, the three forms of the word ``fact'' shown above are assigned a frequency of occurrence equal to one each while in reality a frequency of occurrence equaling three should be assigned for the word fact as the three words are simply different forms of the words fact. We can see that to achieve this something more needs to be added to our basic Luhn's technique. Such a system needs to be able to detect equivalent stems (in our example the stem for all the three words is fact) and use these stems while implementing Luhn's technique.
We need to be able to extract the stems of different words and consider two words with the same stem as two occurrences of the same word for the sake of calculating the frequency of occurrence. A standard approach to suffix-stripping is to maintain an exhaustive list of suffixes and remove the longest possible one. Unfortunately, context free removal leads to a significant error rate. For example, we may want the suffix ual removed from factual but not from the word equal. To avoid erroneously removing suffixes, context rules are devised so that a suffix will be removed only if the the context is correct:
Many words, which are equivalent in the above sense, map to one morphological form by removing their suffixes. Others, unfortunately, though they are equivalent, do not (for example, absorbing and absorption). Since there is no easy way of making these fine distinctions, we put up with a certain proportion of errors and assume that they will not significantly degrade effectiveness. Experiments have shown that the error rate tends to be the order of 5 percent [And71]. It has also been shown, that using a slightly different approach to stemming [Lov73] also produces errors of the same order of magnitude.
Once we have generated keywords for an article, we need to match sets of article keywords with those in the user profile and return a numeric indication of the closeness of the match of the article for the user. We shall henceforth refer to it as the Matching Function.
We need the matching function to compute the degree of match between the article keywords and the keywords in the user's profile. Let D be the set of keywords representing the document (extracted as explained above) and Q be the set of keywords representing the users profile. We use the Overlap Coefficient to measure the degree of match. This coefficient, M, does not take into account the sizes of D and Q. This is important as the number of article keywords could be much larger than the keywords in the user's profile. Also the implicit keywords for a user grow with time and can be much larger in size than the users profile. In such cases it is important to use this technique as what we need to check is not how many of the words in the two sets match, but what percentage of the profile's words match. For example both users A and B should get the same score if all the words in their profile are found in the article. This should not change even if user A had specified only 2 words in the profile and user B had specified 100. This technique is a normalized version of the simple matching coefficient. The formula to calculate the overlap coefficient is given below:
We now concisely describe the complete content based filtering algorithm. To calculate the rating M for every article we maintain a list of possible suffixes (for example, ion, ual, ate). We shall henceforth refer to this list as the suffix list
After we calculate the predictions computed by the content based filtering and collaborative filtering algorithms respectively, we need to integrate these scores and return one number that is an indication of how well the user would like the article. In this section, we shall briefly describe the techniques we use to integrate the content based and collaborative filtering predictions into one aggregate prediction.
The content based predictions would be more accurate in cases where the number of users or the history between users is low. The content based predictions for particular users may also be more accurate in general if the the number of users who are similar to the user in question is low. So if user A and user B agreed on most issues except one and the prediction for user A for an article on that issue was based only on user B we can see that the prediction made thus will not be accurate. On the other hand, if this prediction was based on the opinions of many like-minded users the margin of error would be much less. The content based score would also be more accurate on topics where the user wants to see articles irrespective of the opinions of others.
Similarly there are cases where the collaborative filtering score should be relied on more. This happens if the user has not specified enough keywords in his profile. The collaborative filtering score would also be more reliable for articles which have similar but not the same words/topics described in the users profile. This is where the user's past history of agreement with other users may help as these other users may have the similar words in their profile and his agreement in the past with other users would indicate that the article in question should get a high rating.
Both the collaborative filtering and content based scores are important but the extent of their importance towards the aggregate score (or prediction) is very user-specific. We therefore propose a system where the aggregate score is a weighted average of the collaborative filtering and the content based scores. We also ensure that the weights attached to the collaborative filtering and the content based score are different for different users. These weights may also change over time to reflect the change in a user's taste.
We integrate by giving an equal weight to both the collaborative filtering and the content based scores for all the users. We then adjust these weights according to the rating the user gives to every article. This is done by comparing both the collaborative filtering and the content based scores respectively to the rating given by the user for the article. If the collaborative filtering score is closer to the rating given by the user then we adjust the weights to give the collaborative filtering score a higher weight than the content based score for future articles and vice versa. The exact value by which the weights are adjusted depend on the history. The formula for calculating this adjustment is specified in the algorithm steps given below. This is an ongoing process making the system self-learning. The increase or decrease in the previous weights is also a function of the number of articles the user has already seen. This means that a difference in the respective scores and the rating given by the user would lead to a greater change in the weights if the user had seen just two articles than if he had seen two hundred articles before the article in question. Though such a system is slow-learning, as it adapts to changes in a user's tastes slowly, it also ensures that the system does not change drastically by ratings to articles that are unusual. For example, in cases where a user wants to rely only on his profile for articles on basketball and the article in question happens to be on basketball. In such a case, even if the article has received a low collaborative filtering score we don't want to change the weights by giving the content based score a very high weight compared to the collaborative filtering as the collaborative filtering score may be more accurate in general and only be bad for articles on basketball.
We now concisely explain the complete algorithm to implement the above.
Integration Algorithm
final prediction = 0.5 * collaborative filtering score + 0.5 * content based filtering Score
We realize that to test a collaborative filtering algorithm that also integrates content based filtering techniques, it is essential to be able to get both the ratings of real users and the content of the articles they rate. The EachMovie database has data only on the ratings of the movies seen by the users. There is no information on what movie the rating is for. Movies are represented only by article numbers and not names. This makes it unusable for our experiments on the integration of content and collaborative filtering experiments. For this purpose we have built a system that gives the predictions for newspaper articles for the users of an online newspaper [MSNM99]. This system allows the users to rate these articles and collects the ratings given. The system allows users to maintain profiles (containing sections and keywords for sections) specifying the users interests (if any). The system then computes correlations between users and gives predictions (for articles not yet rated by the user) based on both the collaborative filtering base algorithm described in section 3.1 and the content based filtering algorithm discussed earlier. We will use this system to collect the ratings given by the user and the predictions computed by the system to test the accuracy of predictions.
In this section we first describe the general design of our system. We shall focus on the techniques used to calculate correlations between users and to compute a prediction for a particular article for a user. We then describe the experimental setup for our content based improvement focusing on how we compute the ``accuracy''(or effectiveness) of a prediction.
The online experiments use real ratings submitted by real users on a live system [MSNM99]. This system is designed to develop a customized on-line newspaper for the Telegram and Gazette. This uses a group of 18 users as a test-bed and collects ratings from these real users as opposed to our off-line design. We shall now briefly discuss the design of the system.
The system can be broadly divided into two parts: the front end and the back end. The front end consists mainly of the graphical interface that allows users to login and setup user profiles required for the content based filtering. User's profiles are divided into the various sections of the newspaper and users can choose to specify keywords that reflect their interests. The front end is also responsible for showing users the predictions for various articles and collecting the ratings given by users for the same. These ratings are then uploaded to a database.
The back end of the system mainly consists of the database (where the ratings and scores are stored) and the algorithms which compute both the correlation between users and the prediction for an article. Correlations between users are re-computed similar to the off-line design (i.e. the system uses the Pearsons correlation coefficient to calculate the correlations) once every day. The back end is also responsible for converting the individual content based and collaborative filtering scores to an integrated overall score using the algorithm developed by us. This integrated prediction is then used as a measure of likability of the article. The prediction is later compared with the actual rating that the user give for the article. This is done to get a measure of the accuracy of the prediction. The front end shows a sorted list of articles in the order of the predictions each time a user logs into the system.
We perform various analysis on the data collected by the online system. The system computes the prediction for a user for a specific article. We compare this with the actual rating that the real user of the system gives to the article. We then compute the difference between the prediction and the rating for that article. This is done for all users for all articles. This lets us compute not only the average inaccuracy (over all the articles) for that user, but also the average inaccuracy for the whole data set.
We then determine the accuracy of the prediction computed by the system using the same measures of accuracy described in section 3.2.2 for the off-line experiments for our collaborative filtering improvements. We shall determine the accuracy by the number and the severity of errors as defined earlier in section 3.2.2. We shall use the Mean Absolute Error for the same.
We carried out experiments on data collected from the live system developed by us [MSNM99]. The data set comprised of 18 users. The articles in the data set comprised of all the articles appearing in the newspaper for 2 months, Ratings submitted by the users ranged from 1 to 10.
The graph in figure 4.3 shows the average inaccuracy in the collaborative filtering scores for different users over time. We can see that in the initial phases there is no value for some users as the system is unable to even generate a collaborative filtering prediction for that particular user in this time period. The system is unable to generate collaborative filtering predictions for the user in the graph as the user does not have at least two articles in common with any user. This means that the system cannot generate a correlation between this user and any other user in the system. We also know that our system can compute content based scores for every article for the user as long as the user has either specified something in his profile or has rated at least one article. The system cannot generate predictions for only those cases where the article for which the prediction is being generated is the first article a user is reading and the user has not specified anything in his profile. In this case, the system can use neither the implicit keywords nor the users profile to compute the content based score.
We can thus claim that the integration of content based techniques with pure collaborative filtering techniques can ensure that the system can generate predictions for almost all articles (except sometimes the first article) for all the users.
Figure: Plot showing the average inaccuracy in the collaborative filtering score with time.
We also perform analysis on the whole data set to see the relative inaccuracies of the pure collaborative filtering score, the content based filtering score and a combination of the two. The graph in figure 4.4 shows the inaccuracy of the individual collaborative filtering and content filtering scores as well as the integrated score (the prediction returned to the user by the system).
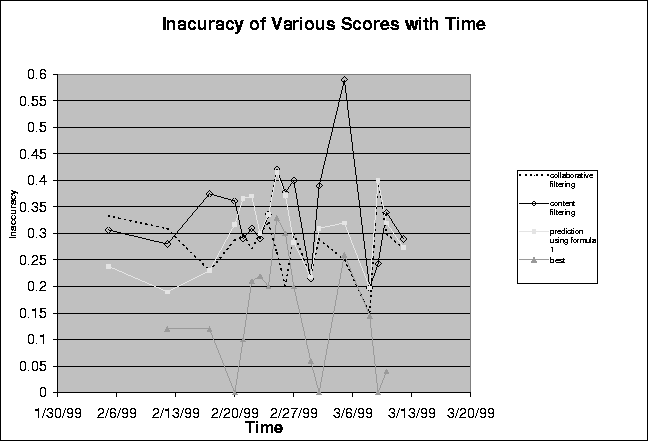
Figure: Plot showing the relationship between the inaccuracies in the content based filtering score, the collaborative filtering score and the integrated prediction. This dataset consists of the ratings of 18 users and all newspaper articles over 2 months. Percentage inaccuracy is an average of the percentage of inaccuracies in the prediction for every pair of users and movies in the data set.
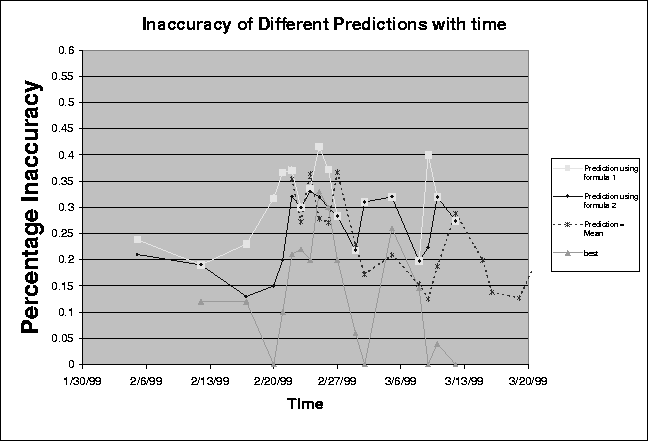
Figure: Plot showing the relationship between the inaccuracies in the predictions computed using different techniques. This dataset consists of the ratings of 18 users and all newspaper articles over 2 months. Percentage inaccuracy is an average of the percentage of inaccuracies in the prediction for every pair of users and movies in the data set.
We can see from figure 4.4 that the collaborative filtering score is more inaccurate in the beginning. This as we mentioned earlier is because of the the fact that the number of users who have a correlation with the user in question is very few. We have also shown in chapter 3 that if the history in common between people is low then the predictions generated by pure collaborative filtering techniques are more inaccurate. The graph shows that the collaborative filtering score becomes more accurate with time.
We can also see that the content based filtering score is generally more accurate than the collaborative filtering score in the initial stages of the graph. In some cases the collaborative filtering score cannot be computed by the system at all. In such cases the content based score can be returned to the user as the prediction. This ensures that the system can compute a prediction for all users for most articles. We also see from the graph that the integrated score (prediction) in fact becomes more accurate than the collaborative filtering score in the initial stages of the system because of the effect of content based filtering. The integration of content based filtering techniques, thus, helps improve the accuracy of the prediction. Figure 4.4 also suggests that the integrated prediction (the curve labeled prediction using formula 1) becomes more inaccurate than the collaborative filtering score after a certain time has elapsed. We have discussed earlier that the integrated prediction is a weighted average of the content based and collaborative filtering scores. We believe that this inaccuracy arises because the weights assigned to the collaborative and content based predictions are inaccurate. The content based score is generally more inaccurate than the collaborative score in the later stages of the system and assigning it a high weight will lead to more inaccuracy. The curve labeled best shows the inaccuracy in the prediction if the weights assigned were optimal. We calculate this by assuming that if the rating was between the content based and collaborative filtering predictions than the inaccuracy would be zero if the weights assigned were optimal. Similarly, the inaccuracy would be the smaller of the differences between the rating and the content based and collaborative filtering scores if the rating was either less than or greater than both the collaborative and the content based predictions.
We also compute the predictions using different techniques of computing the integrated prediction. The technique used in formula 2 is described in more detail in section B.1. Figure 4.5 shows the prediction that is computed by three different techniques. The curve showing the inaccuracy of the prediction using formula 1 refers to the inaccuracy in the prediction computed when the prediction was computed as described in section 4.4. The curve showing the prediction inaccuracy using formula 2 refers to a the computation of the prediction using a different technique described in section B.1. The curve labeled Prediction = Mean refers to the inaccuracy in the prediction when the prediction returned is the mean rating of the particular user (this is the mean of all the ratings the user has given till that time). The curve labeled best is the same curve shown in figure 4.4. We can see that in general the prediction computed by using formula 2 was more accurate than the prediction computed by using formula 1. In some cases both the predictions were the same as the system was unable to compute either the collaborative or the content based score and therefore the prediction was the same as the score the system was able to compute. For example, if the system was unable to compute the collaborative filtering score, then the prediction returned was the same as the content based prediction, and therefore, was the same in both cases.
Finally, we make the following observations on the integration of pure collaborative filtering techniques with content based techniques:
The above results suggest that it is useful to integrate content based filtering with pure collaborative filtering. This is specially true as pure collaborative filtering techniques do not perform well in the initial stages and improve as users rate more items. In real life situations, this gets more difficult as most users stop using the system when they initially see inaccurate predictions or when the system cannot compute predictions for the particular user.
From all our experimental results,, we have reached the following conclusions:
We make the following observations from our experiments on user thresholds on this data
We have conducted experiments on the data extracted from the EachMovie database. The data in the EachMovie database had been collected from real users using a live system that grew over time both in the number of users as well as the number of articles in the database.
We make the following observations from our experiments on history thresholds on this data
We feel this is because of the fact that predictions made based on the opinion of people who have seen very few articles in common with the user in question is more prone to error. There is very little justification in assuming that users would exhibit the same degree of like-mindedness that they have shown in the past if the number of articles on which this degree of like-mindedness is computed is very low. For example, the fact that user A and user B have seen just two movies in common and have liked both, does not necessarily imply that the they will have the same opinion of the third movie they see in common. If, on the other hand, the number of movies seen and liked in common by user A and user B was two thousand then we are almost justified in saying that they have similar opinions on movies and so will have the same opinion on the next movie they see in common.
We have seen that the standard deviation of the error in the prediction decreases with increasing history thresholds. As 60 percent of the total predictions lie within one standard deviation of the error, a decrease in the standard deviation means that 60 percent of the inaccuracies in the predictions lie within a small range of the average inaccuracy in the prediction. This implies that predictions computed are more consistent. As earlier results show that the inaccuracy decreases with the history thresholds, this implies that the algorithm gets more consistently accurate with increasing history thresholds.
Though we have conducted experiments on varying sizes and shapes of data sets we haven't come across a single case where the prediction made by the system is outside the valid range of ratings allowed.
We therefore conclude, that such situations, though possible theoretically rarely occur. The implementation of normalization techniques thus seems like a wasteful computation. We therefore have reached the conclusion that the implementation of normalization techniques will not yield much benefit.
The amount of information available to individuals is overwhelming. The Web, along with Usenet News, email, newspapers, books etc. contribute to an intimidatingly large information space. There is a clear demand for automated methods that filter as well as locate information with respect to users' individual preferences.
Collaborative filtering is a personalized technique to filter information. Collaborative filtering predicts the ``likability'' of an item based on the opinions of like-minded users in the system using their statistical correlations as the weights in a weighted average. These techniques consider the opinions of all users and therefore can be prone to inaccuracies in the prediction if the opinions of the few like-minded users get overshadowed by the opinions of many users with a low correlation. Users with low correlation do not have a pattern of similarity/dissimilarity of opinions with the user. Their opinions should ideally not be considered at all. Collaborative filtering also becomes inaccurate when the correlation between users is based on very few articles seen in common. Correlations based on a low number of articles in common are unstable and may not correctly reflect the degree of similarity between two users. We reduce the collaborative filtering inaccuracy by implementing thresholds.
The basis algorithm [RIS94] computes the prediction by considering the ratings of all users that have a correlation with the user in question. We implement correlation thresholds such that we compute the prediction considering the ratings of only those users who have a correlation higher than the threshold.
We have shown that the application of correlation thresholds increases the accuracy of the prediction. There is, however, no correlation threshold that works best for all the users in the data set. Predictions are most accurate when correlation thresholds are specific to a user. This correlation threshold value depends on the number of users who have a correlation above this threshold value with the user in question.
A side benefit of this improvement is that correlation thresholds provide a reduction in the computation cost involved in the prediction as the number of users considered is smaller.
The basis algorithm [RIS94] computes the prediction by considering the ratings of all users irrespective of the number of items seen and rated in common between the users. A problem with this technique is that users may not have seen enough messages in common to have the correlation between them accurately reflect their like-mindedness. For example, a history of only two messages in common and a correlation of 1.0 is probably not sufficient basis to say that the two users are likely to agree on the third message. We implement history thresholds such that we compute the prediction considering the ratings of only those users who have the number of items rated in common between them higher than the threshold.
Our experiments show that implementing history thresholds improves accuracy of the prediction. Although implementing a uniform history threshold increases the accuracy of the predictions on average, the best value of the history threshold varies from user to user. Predictions computed for a user are most accurate when history thresholds are specific to a user. This threshold depends on the number of users who are considered for the prediction. The best threshold, therefore, depends on the number of users who have a history above the threshold with the user in question.
We have also shown that the application of history thresholds also leads to predictions that are also more consistently accurate. The standard deviation of error in the predictions decreases rapidly with increasing history thresholds making the error in the predictions more consistent. This observation can be used to get an indication of the strength of the prediction and can be returned to users to give them an indication of the confidence they can place in any particular prediction.
Collaborative filtering provides inaccurate predictions to users that do not have many like-minded users. Also, collaborative filtering does not allow a user to specify that a particular content be given a higher prediction. Finally, with collaborative filtering alone, users who are the first to rate an item cannot get predictions for it. We integrate content based techniques with collaborative filtering to alleviate the effect of the above problems.
We devise an algorithm that implements keyword matching to perform content based filtering for news articles. Our algorithm uses the keywords specified in the user's profile and the articles keywords to compute a content based score. Our algorithm also uses a set of implicit keywords (extracted from articles liked by the user in the past) and the news categories (for example, world news, sports etc. ) that the user has selected to compute different content based scores. We have devised a technique to integrate these three scores (explicit keywords, implicit keywords and the category) to compute an overall content based prediction for the user.
We use a weighted average that is adaptable to the relative accuracy of each score and user specific. The weights assigned to the collaborative and content based predictions are not only dynamically modified to reflect the user's choice but are also user specific. This is important as the collaborative filtering prediction might be more accurate for some users while the content based filtering score might be more accurate for others, depending upon the correlation and history in common with other users as well as how well the user has set up her profile.
Our experiments show that the collaborative filtering score is less accurate in the startup phase of the collaborative filtering system. In extreme cases, the system is unable to compute a collaborative filtering score for a user. This can happen if the user is the first person to rate the article or if the system is unable to compute a correlation for the user with any other user (a user has to have rated at least two articles in common with another user for the system to be able to compute a correlation between them). We also see that in this startup phase the integration of the collaborative filtering score with a content based score leads to predictions that are more accurate. At the very least, it allows the system to compute some prediction based on the content based score if the system is unable to compute a pure collaborative filtering score. We have also shown that the integration of content based filtering techniques allows the system to compute a score for new users who have not rated a single article. The only case when the system is unable to compute a prediction is when the prediction is being computed for a new user who has not specified anything in the profile and is reading the first article.
We implement each of the improvements individually and show that they return a benefit over the basis algorithm. We have seen that correlation thresholds do not improve the acuracy of predictions unless the number of users is above a certain minimum. This, for example, suggests that the implementation of correlation thresholds in conjuncture with users thresholds would be more beneficial. Though most of the individual improvements lead to an increase in the accuracy, we feel that implementing all the improvements would lead to more accurate predictions.
For our off-line experiments we have assumed that all articles belong to the same information space. That is, the correlation between users that we compute and consider for the prediction is based on all the articles that both the users have rated. Let us assume that the users have rated articles on different topics and have different degrees of correlation for each topic/category of the information space. A pair of users can have a high correlation on certain topics and a really low one on others. In this case, the system does not efficiently use the high correlation even if it is computing a prediction for an article in the category where the users have a high correlation. For example, consider the case where two users A and B always agree on the movies they see (have a high correlation for movies) but do not agree on most other topics (they have a low overall correlation). In this case, though user A has a low correlation with B in general, user A would still like the system to give a higher weight to the rating of user B for all articles on movies. We do not implement non-linear correlations in our off-line experiments. We believe that computing separate correlations for different information categories for a pair of users will be more effective than computing one overall correlation between users.
Our experiments use the ratings given by a pair of users for all the articles/movies seen in common to compute a correlation between them. This includes those articles/movies that are universally liked (liked by most users in the data set) or disliked. It can be argued that such articles/movies are not really as useful in capturing the similarity between users as less universally liked/disliked ones. We can extract the actual similarity between two users' opinions if we compute the correlation based on just those articles/movies that are not universally liked or disliked. Such a technique might improve the accuracy with which the correlation captures the degree of similarity between people and thus improve the prediction.
In our content based filtering algorithm we perform a keyword matching of the user's profile and the article's keywords. We generate the article's keywords from it's text. Words falling between a lower and upper cutoff (refer section 4.2.2) are considered to be the keywords of the article. In our work, these cut-offs have been set to one-fourth and three-fourths of the rank order of the words. We feel that a study on the determination of these cut-offs and thus choosing the best cut-offs might improve the performance of the content based filtering algorithm thus improving the performance of the integrated algorithm.
For keyword matching in the content based algorithm we use the stems of words (the part of the word that remains after the word is stripped of it's suffix). Most words reduce to the same stem when the largest suffix is removed from them. For example, both ``facts'' and ``factual'' reduce to the stem ``fact'' when the largest suffixes in the respective words, s and ual, are removed). Some words, on the other hand reduce to different stems even when they are essentially the same. For example, ``absorption'' and ``absorbing'' reduce to the stems ``absorp'' and ``absorb'' and will be treated as occurrences of different words. One way to reduce this problem would be to construct equivalent stem endings and then use these to identify similar words. In this case, ``absorb'' and ``absorp'' are equivalent stem endings. Implementing these techniques should lead to somewhat more accurate content based scores and therefore better predictions.
The accuracy of the keyword matching technique also depends on how accurately the keywords extracted from an item reflect its content. Removal of common words (such as articles) by pre-processing the content with a 'stop-list' before extracting keywords for the article might improve the accuracy of the keyword matching technique to compute a content based prediction.
We used the keyword matching technique on the user's profile and the article keywords to compute the content based score. Once disadvantage of the keyword matching technique is that it depends on the exact word (the word ``stem'' in our system) and does not exploit the semantic content of the keywords. This can lead to inaccuracies as people use different words to to describe the same concept. Latent semantic indexing (LSI) overcomes this problem of variability in human word choice by automatically organizing textual information into a semantic structure into a semantic structure more appropriate for information retrieval. Using LSI to compute the content based score might lead to more accurate content based scores as LSI does not depend on exact word matching and will therefore perform better content analysis.
The complete content based algorithm in section 4.3 computes three different scores to compute the content based score. These scores, Me, Mi and Mc are based on the keyword matching between the user's profile and the explicit and implicit set of keywords for the article. These scores are then integrated using a weighted average to compute the complete content based score. The weights given to each of these scores by us are equal and are arbitrarily assigned. Future work in the correct assignment of weights to these scores will improve the content based score and thus the integrated prediction.
We integrate the content based and the collaborative filtering predictions using a weighted average. Both the predictions are assigned equal weights in the beginning. These weights are dynamically modified depending upon which prediction is closer to the actual rating submitted by the user. A future work in this direction is to investigate hill climbing techniques as a means of adjusting the collaborative and content-based weights.
One limitation with the Pearson's correlation coefficient we use is that it depicts a linear relationship. If a pair of users have a strong correlation but it is nonlinear then this may not be reflected as a strong correlation and used as such by the system. For example, consider two users A and B such that they have a low correlation when B likes an item but have a high correlation whenever B dislikes the item. This means that they dislike similar items but may not like similar items. The system should ideally be able to use this information so that B is treated as a ``similar'' user for A whenever B gives a low rating for an article. When calculating a prediction for an article for user A such that this article has been given a low rating by user B, the rating given by user B should be given a higher weight when the system computes the prediction.
Our collaborative filtering system cannot compute a collaborative filtering score for a new article that no users in the system have read. The new article has not been rated by any users and therefore the system does not have any ratings for the article making it impossible to compute the prediction for this article for any user. At least one user has to first rate an article before the system can calculate the collaborative filtering score for any other user for that article. The system handles such situations by just returning a content based score based on the users profile and the article's keywords. Such situations can be dealt with if the system also maintains correlations between articles. For example, if two articles get a similar rating by the same user then this means that the two articles are similar. Articles can conceivably be similar in content if the content based scores returned for them are similar. Thus when a new article enters the system, users can be given a prediction for the article by checking which articles are similar to the new article and using the ratings given by the user for all such articles to calculate the prediction.
The goal of collaborative filtering system is to help people focus on reading documents that would be of interest to them. This requires either filtering documents that are not relevant or computing a score related to each document that represents how much the user would like the document. Our system takes the latter approach.
We have seen on our experiments on the EachMovie data that the accuracy of such a score for a document depends a lot on the number of people who have seen articles in common with the user for whom the score is computed. It also depends on the number of articles seen in common between the user in question and any other user whose rating is considered for the computation of the score. Both the above mentioned factors imply that collaborative systems work well when lots of users have rated lots of articles in common. The accuracy of the prediction (or score) may depend on the sparsity of the data set (we define sparsity as the total number of ratings in the system vs the product of the total number users and articles).
We conducted experiments to study the effects of the sparsity of the EachMovie data set over time and the corresponding accuracy of the data set.
We ran our experiments to observe the change in sparsity of the data set over time. Any data set grows over time as the number of articles coming into the system increases. Data sets also grow as more users join the system. An increase in the size of the data set does not necessarily mean a change in the sparsity of the entire system as users joining the systems may read very few articles either increasing the sparsity or not affecting it much. We therefore ran experiments on the EachMovie Dataset to observe the change in sparsity over time.
We also ran these experiments to see if the average inaccuracy of the of the predictions of the data set correlate with the sparsity of the system. As we mentioned earlier, the number of users who have a correlation in common with the user and the number of articles read in common affect the accuracy of the prediction. This implies then that it is not just the sparsity of the data set but the pattern of distribution of ratings that affect the prediction. We conduct experiments on the accuracy and sparsity of the data set over time to evaluate our hypothesis.
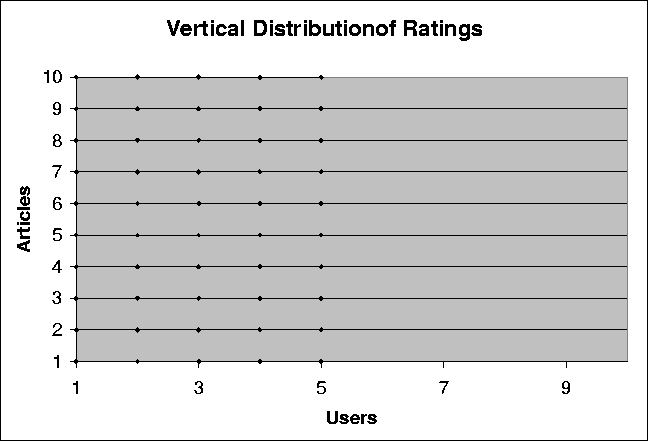
Figure: This graph shows a possible distribution of ratings in a data set where some users have given ratings for all articles in the data set. Each point (x,y) represents the fact that a rating has been submitted by the user x for the article y.
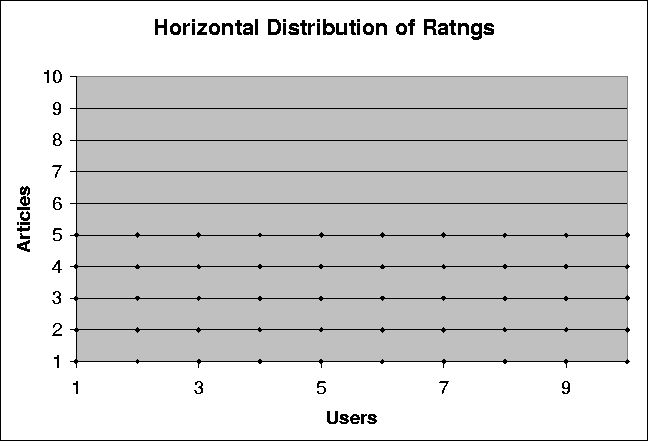
Figure: This graph shows a possible distribution of ratings in a data set where some articles have been given ratings by all users in the data set. Each point (x,y) represents the fact that a rating has been submitted by the user x for the article y.
Figure: This graph shows a possible distribution of ratings in a data set where some articles have been given ratings by all users in the data set and some users have given ratings for all the articles in the data set. Each point (x,y) represents the fact that a rating has been submitted by the user x for the article y.
Figure: This graph shows a possible distribution of ratings in a data set where all the users have given ratings for some articles (not necessarily the same articles) in the data set. Each point (x,y) represents the fact that a rating has been submitted by the user x for the article y.
The figures A.1, A.2, A.3 and A.4 have the same sparsity (50 percent sparse). Each of the above data sets though have different distributions of the ratings stored in the data sets. Figure A.1 shows a data set where all the users have rated th first few articles. In this case, every user has a correlation with every other user. All the users also have rated 50 percent of the total articles in common. No user has rated the other 50 percent of the articles. In this case, it would be impossible to give a pure collaborative filtering prediction for any of the latter 50 percent of the articles for any user. Figure A.2 shows a data set where 50 percent of the users have rated all the articles and the other 50 percent of the users have rated no articles. In this case, since the latter 50 percent of the users have rated no articles, no prediction can be given for any article for any of the latter 50 percent of the articles. The latter 50 percent of the users have no correlation with any other user as they have rated no articles. No prediction can be thus be calculated for these users.
Figure A.4 shows a data set where the history in common between users is varying. This means that for some users the predictions will be more accurate than others. Also some users may not have any articles in common with another user and so will have no correlation value with this other user.
We ran experiments to observe the effect of the sparsity of the data set on the average accuracy of the data set. These experiments were carried out to see if the accuracy of the data set increased with a decrease in the sparsity (higher ratio of actual number of ratings to total possible ratings in the data set) or was affected by the factors stated above.
Figures A.6 and A.5 show the sparsity and inaccuracy of the data set with time. We can see from figures A.6 and A.5 that both these values (sparsity and inaccuracy) of the data set are not a function of time. They neither increase or decrease steadily with time. Also the inaccuracy of the data set does not change inversely with the sparsity. We can thus safely say that the inaccuracy of the data set is not a function of the absolute sparsity of the data set. The data set does not get more accurate as more ratings are entered into the data set. Rather, the inaccuracy depends on the way these ratings are distributed. This means that a collaborative filtering system may not get more accurate with the addition of more users or articles.
This supports our hypothesis that the accuracy of the prediction is a function of the history in common between users and the number of users any particular user has a correlation with. This, in turn, depends upon the way the ratings are ``distributed'' in the data set.
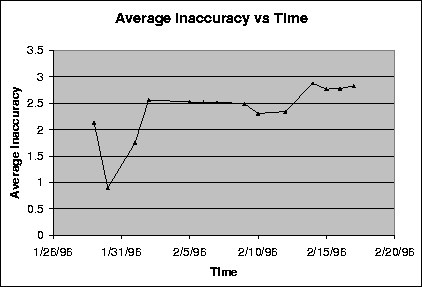
Figure: This graph represents the average inaccuracy of the data set over time. The average inaccuracy of the data set is calculated by taking the average of the inaccuracies in the predictions for every user for every article.
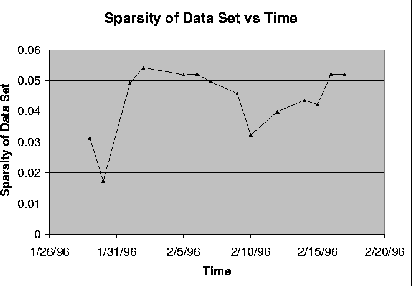
Figure: This graph represents the sparsity of the data set over time. The sparsity of the data set is calculated as the ratio of the total number of ratings in the data set and the total number of possible ratings in the data set.
For data sets where the number of users is large and the number of articles read in common is above a certain threshold, application of thresholds yields little benefit in the accuracy of the prediction. This is typically true for data sets which are ``vertical'' in shape and have very few (or none) of the users having a high correlation with another user. That is, for data sets where the ratio of users to articles and the number of articles read in common is big. This is so as such data sets typically have a low correlation among users as the users have seen a lot of articles in common and so the chance that any two users agree on almost all the articles (which would lead to a high correlation ) is low. The application of thresholds though does not adversely affect the prediction (as long as the number of such users having a correlation above the threshold is reasonable) but leads to a benefit in the computation time.
We have found that the implementation of correlation thresholds yields to an increase in the accuracy for data sets that are horizontal in nature. That is, for data sets where the ratio of user to articles read in common by users is low. This is because users have a low to medium correlation with other users. Applying correlation threshold for such data sets excludes the users having a low correlation with the user in question. This leads to both a benefit in the accuracy of the prediction and the computation time. We also note that the application of correlation thresholds without the application of user thresholds can sometimes have adverse effects as the inaccuracy increases if the number of users above the threshold drops below a certain value.
This document was generated using the LaTeX2HTML translator Version 96.1-h (September 30, 1996) Copyright © 1993, 1994, 1995, 1996, Nikos Drakos, Computer Based Learning Unit, University of Leeds.
The command line arguments were:
latex2html -split 0 thesis.tex.
The translation was initiated by on Wed Apr 28 09:04:48 EDT 1999