![[Hearthstone]](hearthstone.png)
Due date: Tuesday, April 9th, 11:59pm
The goal of this project is to use the game analytics pipeline on raw game data to reinforce a common process in game development. You will obtain game session data, write scripts to parse and re-format the data ("wrangle"), and analyze the formatted data across many games to better understand key game attributes. Unlike in previous projects, rather than have forms of analysis (e.g., charts) prescribed to you specifically, you are to use analytics knowledge you have acquired in doing targeted analysis. Results are presented in a report.
Hearthstone is a free-to-play, online card game developed and published by Blizzard. The game is two-players and turn-based. Players select a Hero and a customizable deck of 30 card with the goal of reducing the opponent's health to zero. Winning matches and completing quests earns gold, allowing players to buy new cards.
For this part, you will gain a basic understanding of Hearthstone, at least enough to undertake the analysis required in this project.
Jump right in an play! And/or, check out Blizzard's guides (in order you should read them):
Other 3rd party guides, videos and more can be found online. For a start:
Don't worry about mastering the game (although you can if you wish and time allows!) - just get a general familiarity with the game rules, cards and playstyle.
Player data for Hearthstone can be collected using the 3rd party Track-o-Bot, a small, easy-to-use app which automatically tracks a player's Hearthstones matches. While you can certainly collect Track-o-Bot data for your own games, that is not necessary for this project. Instead, we will use Collect-o-Bot data, a public repository of Track-o-Bot data. You will analyze one month of Collect-o-Bot 2019 data. Data is published daily and compiled into monthly data sets at the end of each month.
Download the latest, full-month of data.
Note: For testing purposes, you will want to test on a data set that is smaller than one month. For example, you may want to look at data on just one day, say March 15, 2019
Download the latest, one-day of data.
The data is in JavaScript Object Notation (JSON) format. JSON is an open-standard format that encapsulates object data in human-readable text. Data is arranged into attribute-value pairs and arrays (lists) of data.
An example of the JSON format for part of a Collect-o-Bot game file is below:
#!/usr/bin/python3

#
# Parse Hearthstone output file(s).
# version 1.2
#
# Print some stuff.
#

# Needed imports.
import csv
import json
import sys

FILE="change-to-your-file-name"  # e.g., 2019-03-15.json

# Load file as json object.
filename = FILE
data = json.load(open(filename))

# Print out total games.
total_games = data['total_games']
print("Total games: ", total_games)

# Print all Heroes.
i = 0
for game in data['games']:
  print("Game", i, end=": ")
  print(game['hero'], end=" vs ")
  print(game['opponent'])
  i = i + 1

## Figure out how often a 'Paladin' won.
wins = 0
count = 0
for game in data['games']:

  # Main player was a Paladin?
  if (game['hero'] == 'Paladin'):
    count += 1
    if (game['result'] == 'win'):
      wins += 1

  # Opponent was a Paladin?
  if (game['opponent'] == 'Paladin'):
    count += 1
    if (game['result'] == 'loss'):
      wins += 1

print("Paladin games: ", count)
print("Paladin wins: ", wins)
Copy and paste the script. Then, change the name of FILE to the name of the collect-o-bot data file (unzipped). You should see output similar to:
  Total games:  320
  Game 0: Priest vs Warlock
  Game 1: Priest vs Paladin
  ...
  Game 318: Paladin vs Rogue
  Game 319: Paladin vs Mage
  Paladin games:  104
  Paladin wins:  59
Study the script carefully. You will use, copy and modify it (in conjunction with other Python skills used in Project 2) for the analysis required in this project.
Note, see the Hints Section for a script to pretty-print a JSON file.
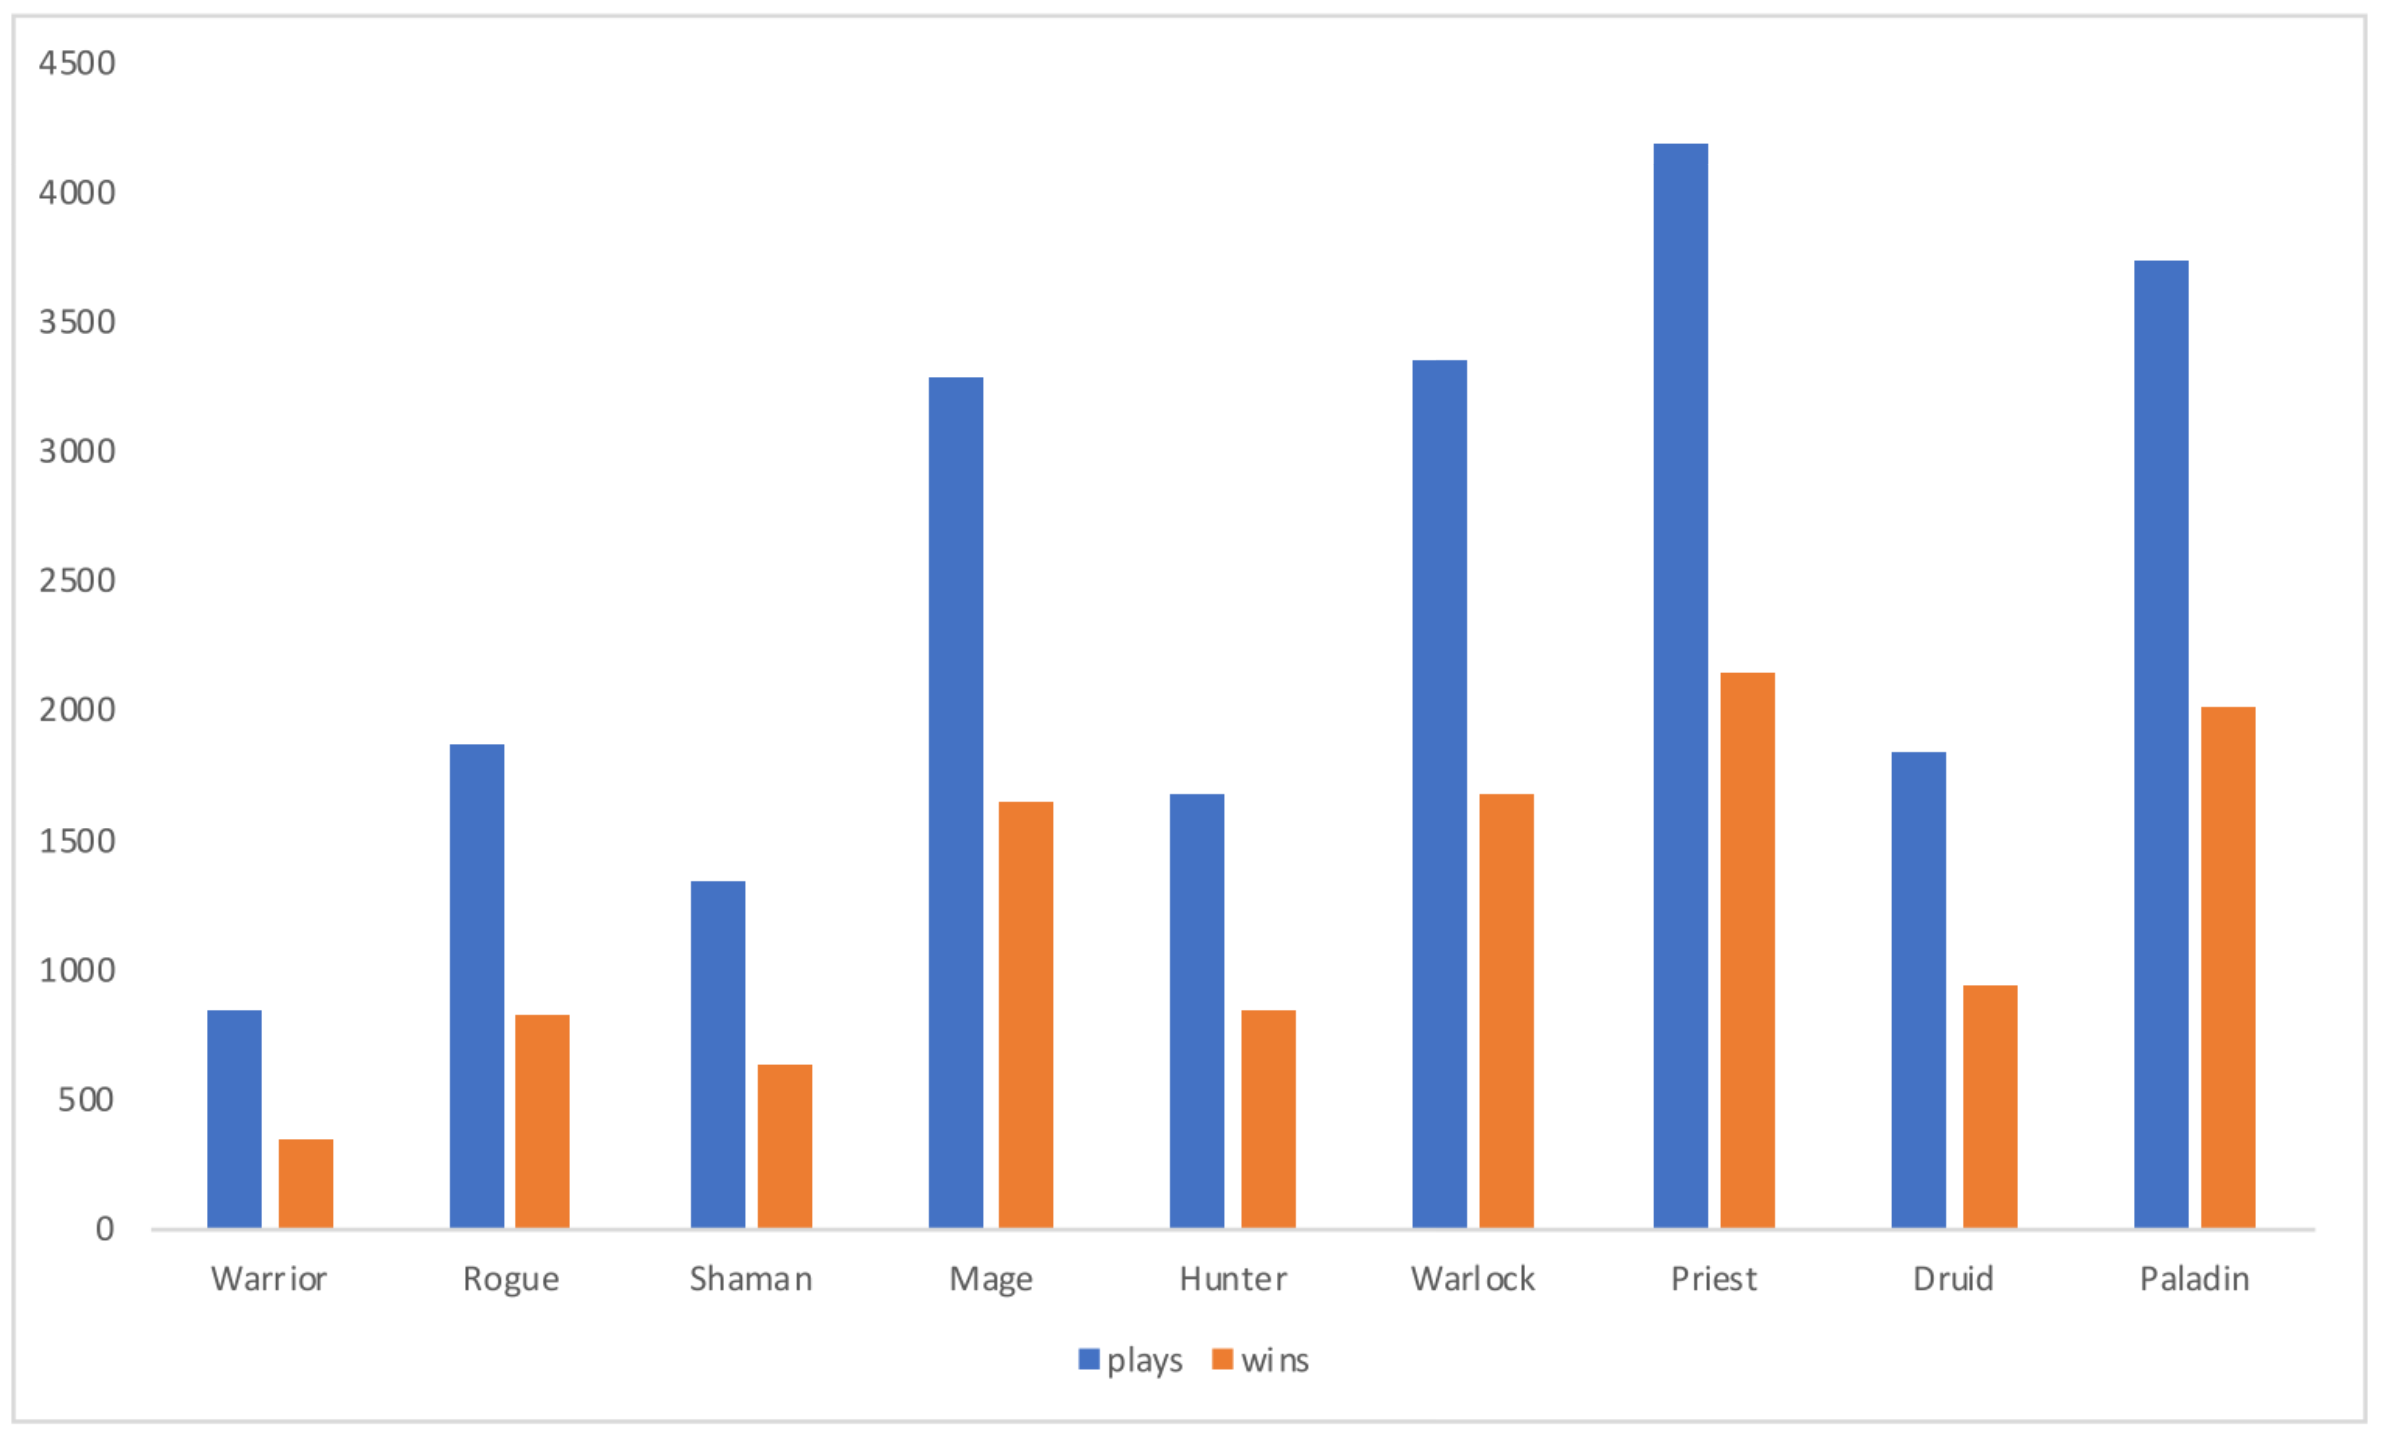
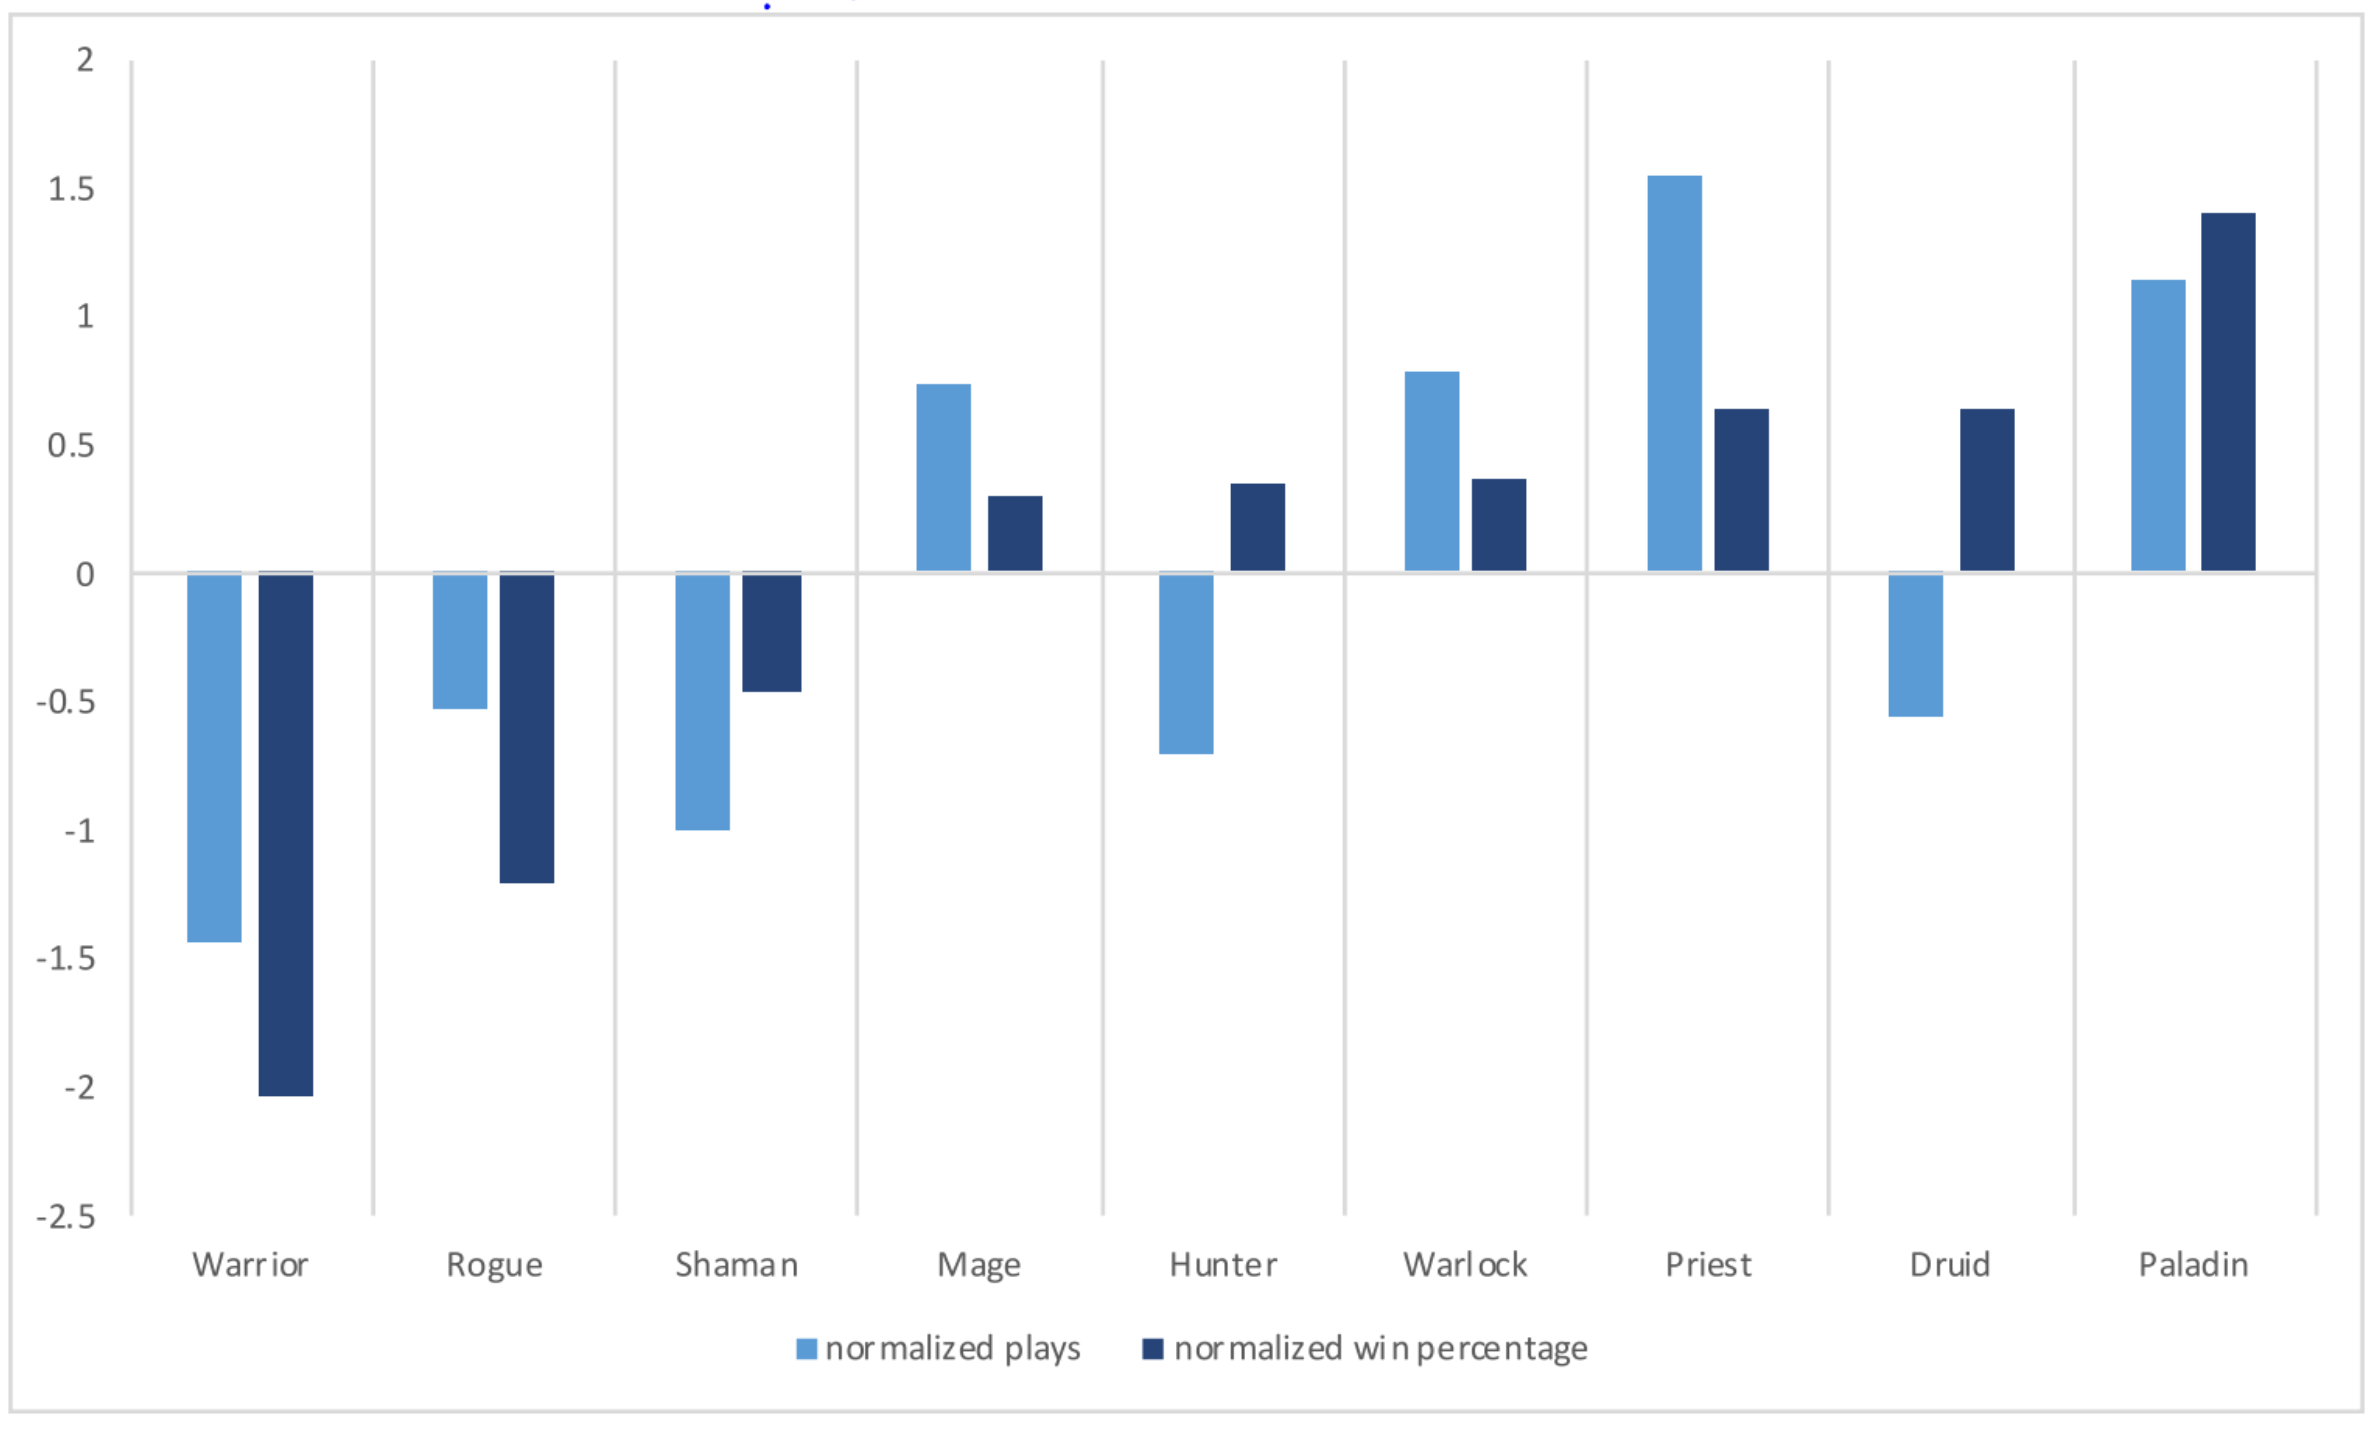
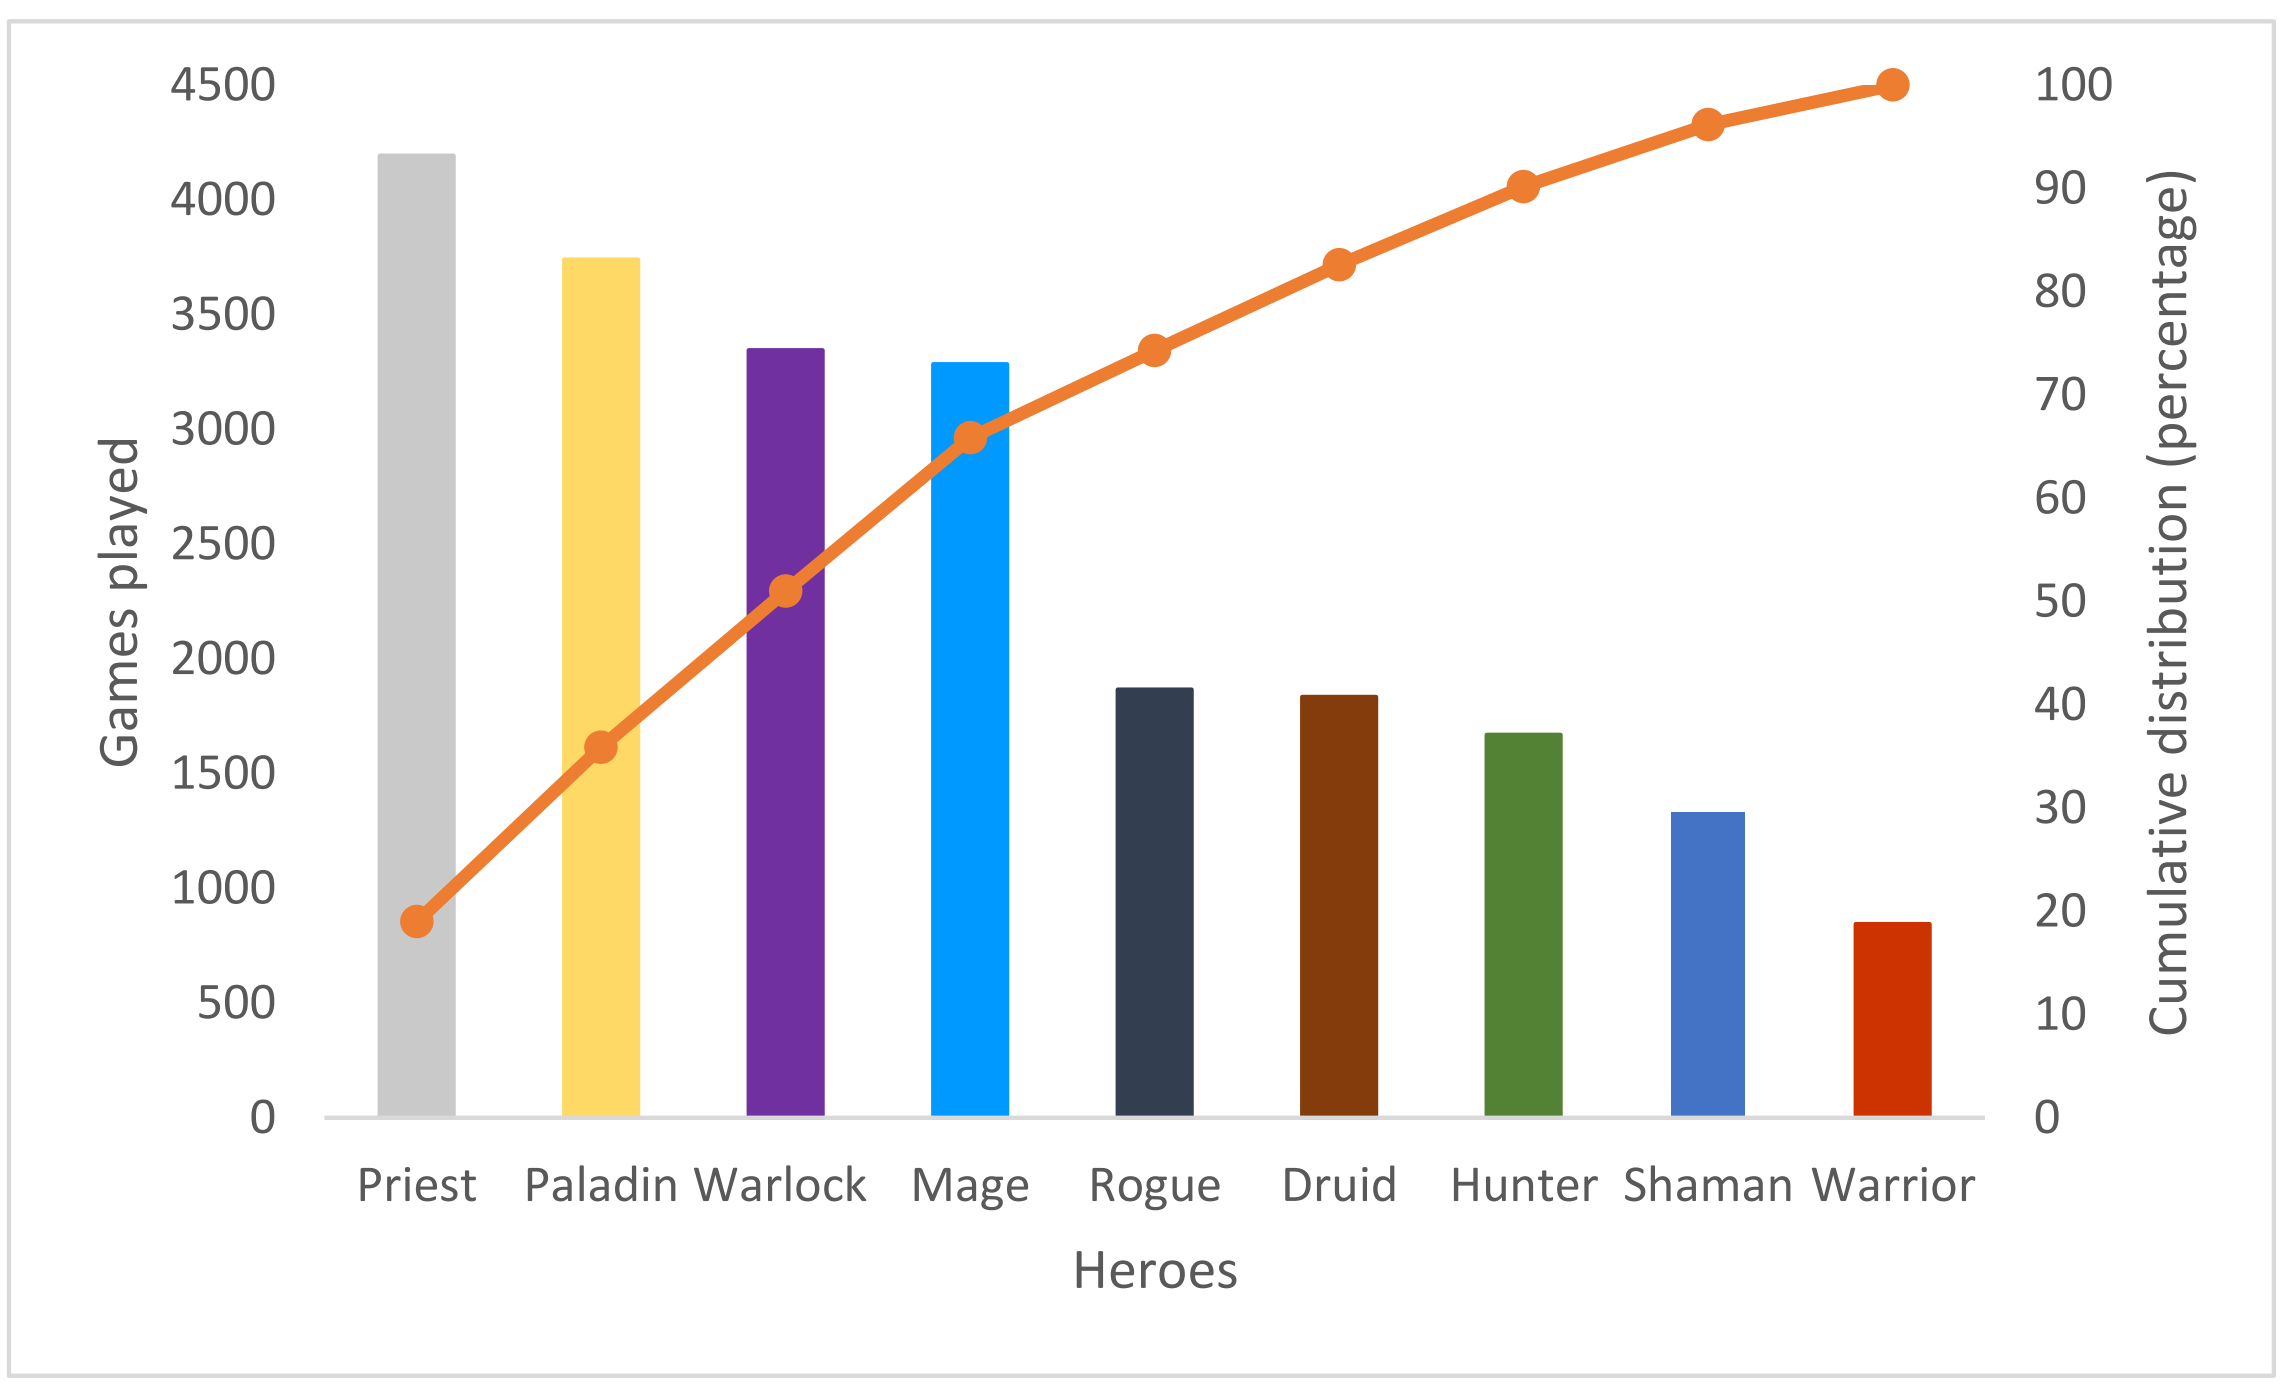
Exploration: How many different Heroes are used? What is popularity of each Hero? How often does each Hero win?
For a month's data, analyze the distribution of Heroes used in all games. Also analyze the Win/Loss rate for each Hero.
Exploration: Which player wins most often - the player that starts or the player that goes second? Do some Heroes do better going second than others?
In turn-based games, going first can often be an advantage. For example, in chess the white player always starts and has a 5% higher chance of winning than the black player.
In Hearthstone, also a turn-based game, the player that goes first could have an advantage by being able to get a Minion out and do damage first. In an attempt to counteract this potential advantage, Hearthstone provides the player that goes second gets The Coin - a unique spell card that costs 0 Mana to play and gives the player 1 additional Mana for that turn only.
For a month's data, analyze the win rate for the player that starts compared to the win rate for the player that goes second (has the coin). Analyze the relative win rate compared to the average for each Hero - in other words, how much does a particular Hero gain from the coin.
Hint: In Python, if you are checking if a JSON value is true or false after loading it, you need use True or False without quotes (i.e., not "True" or "False"). For example:
if ( data['games'][5]['coin'] == True ):
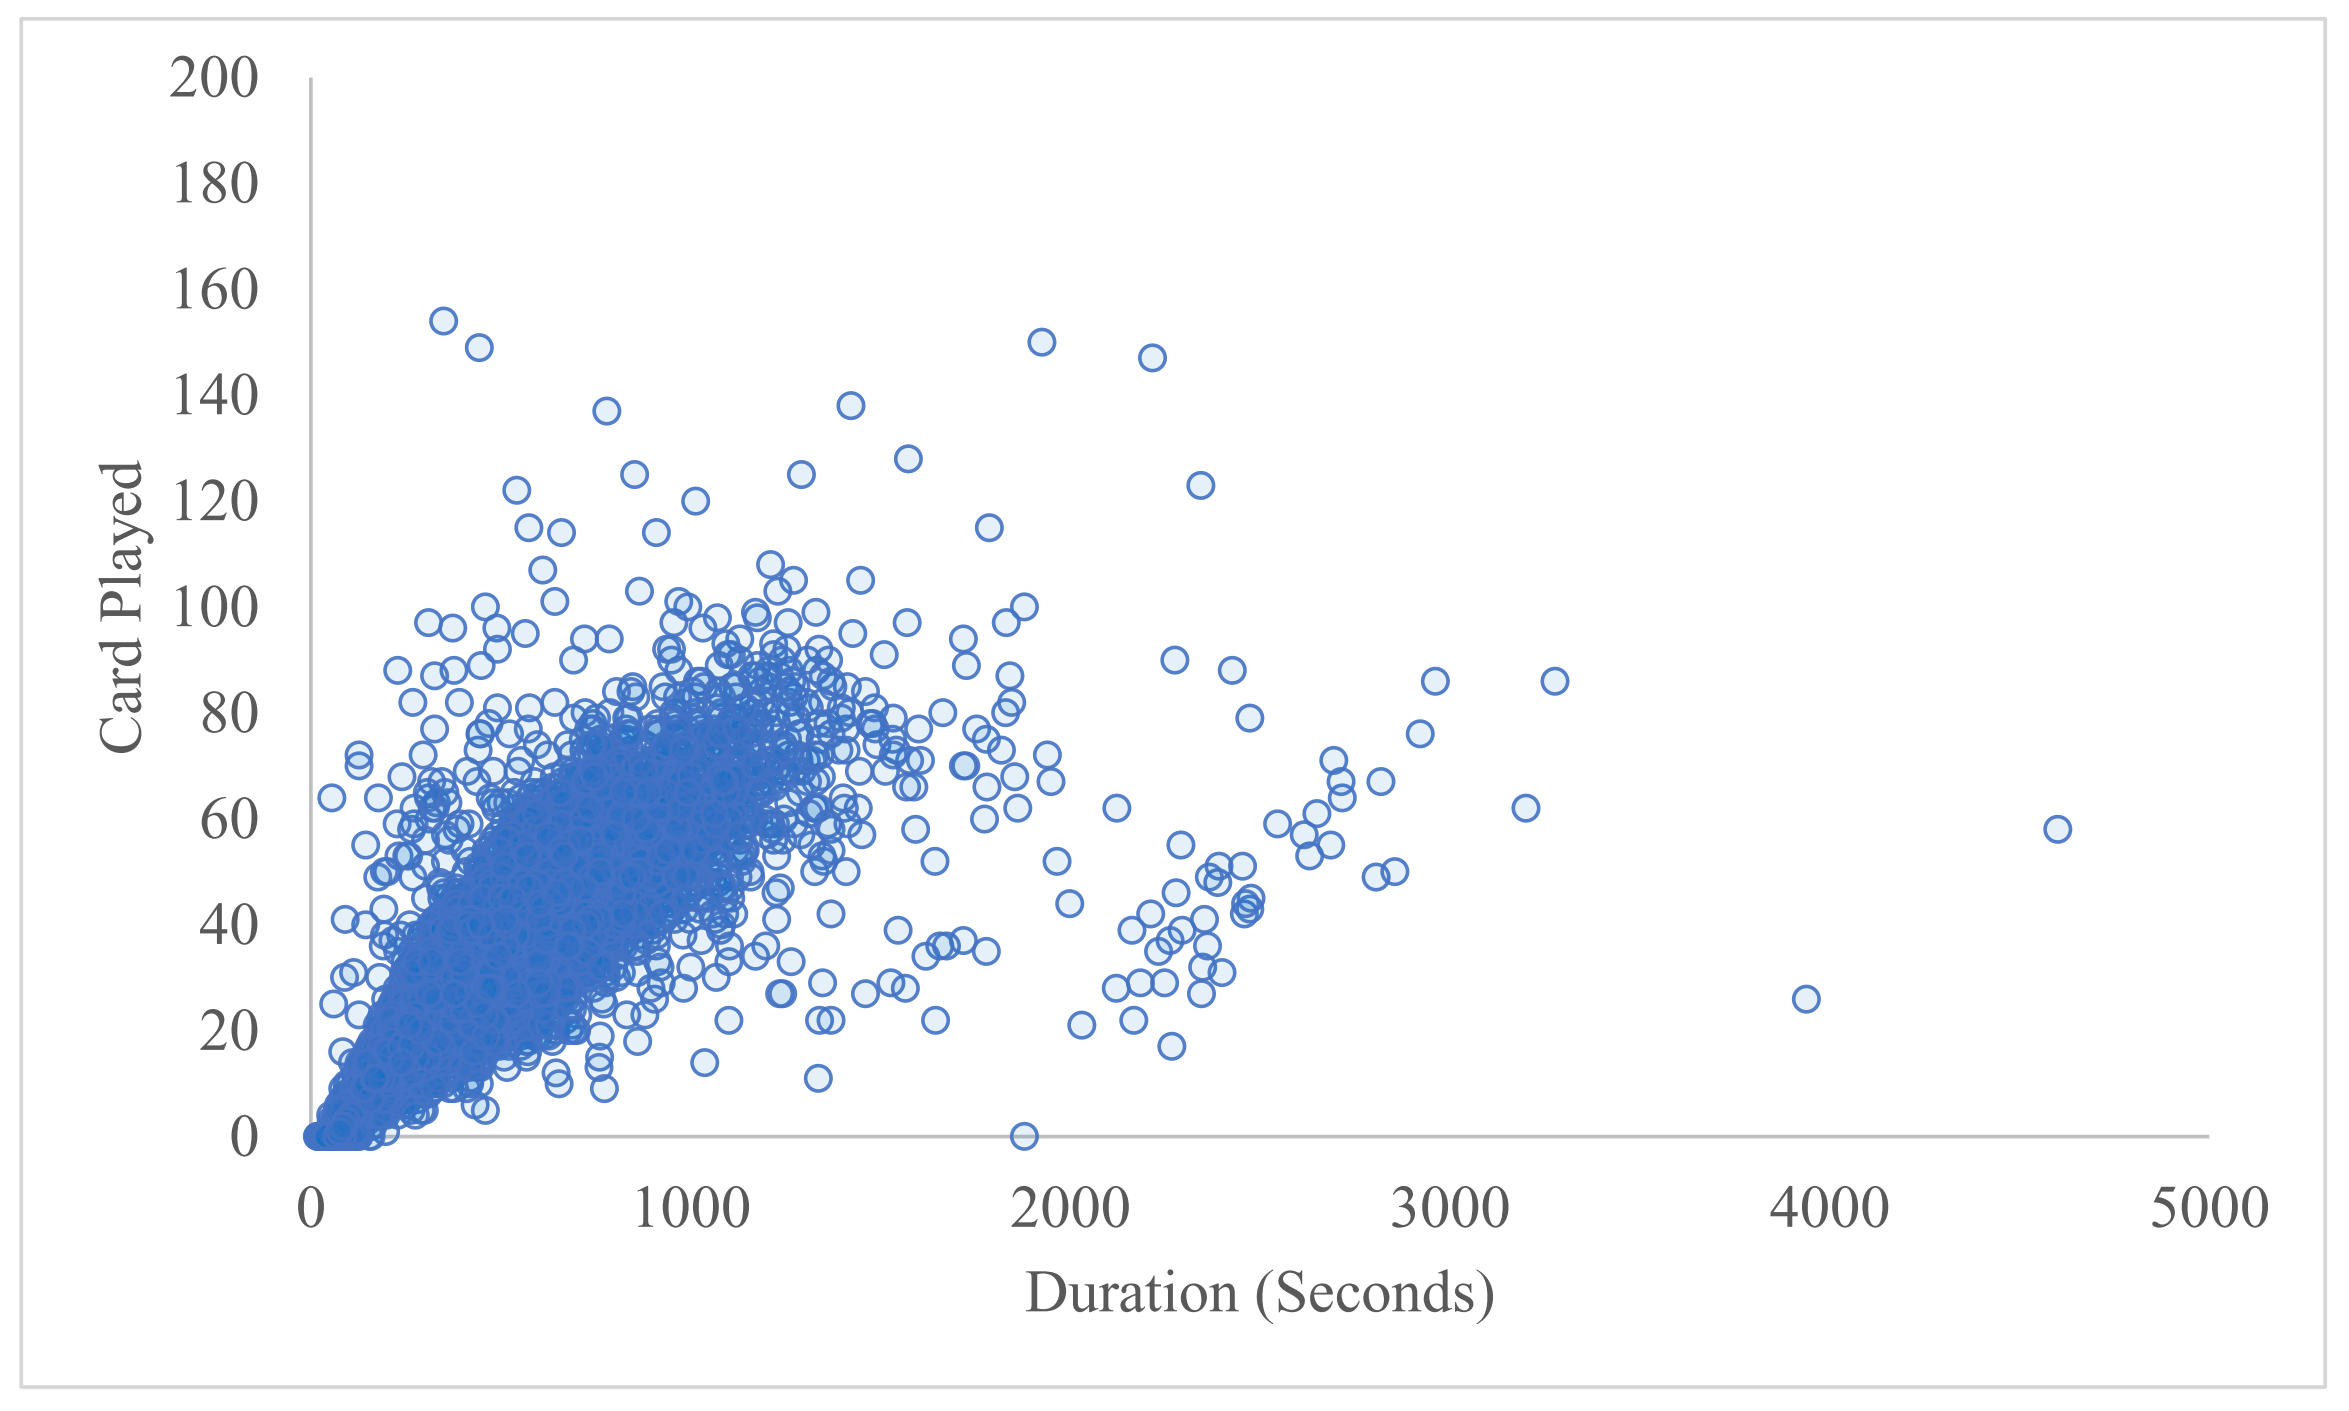
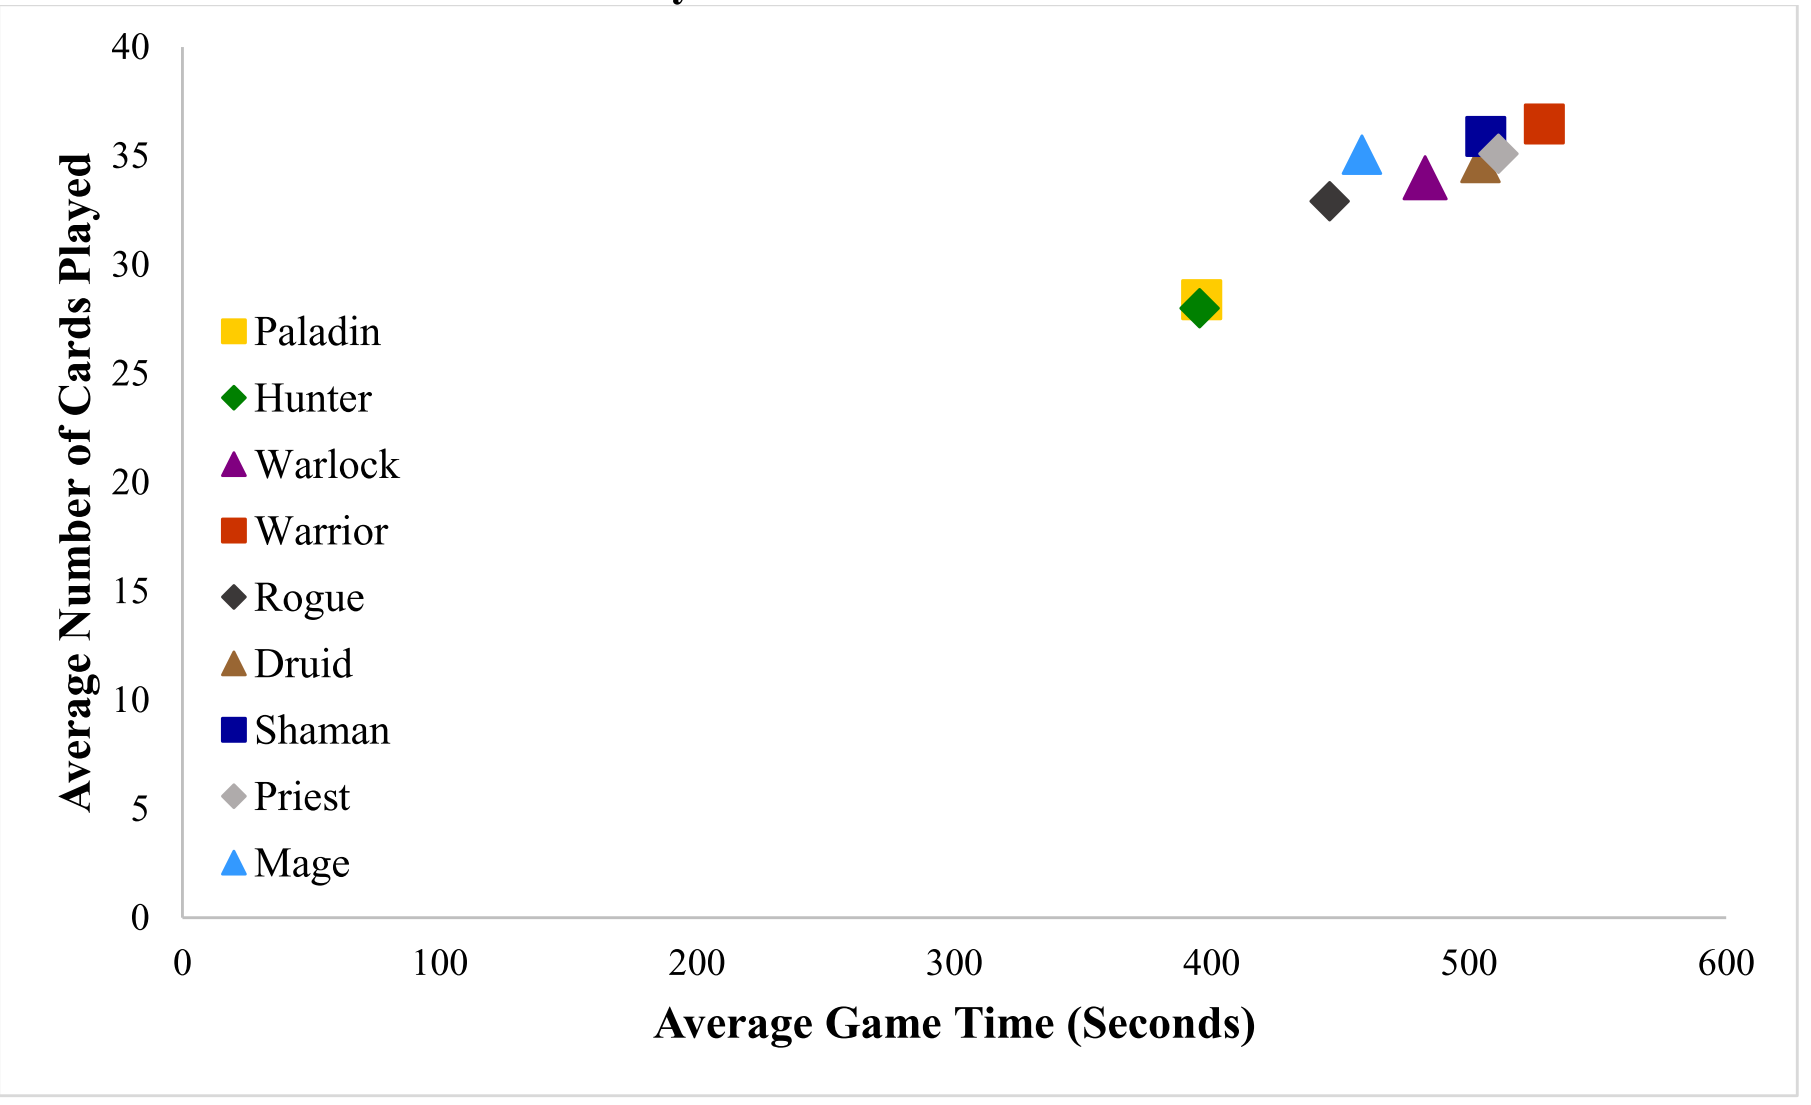
print("In game 5, the main player had The Coin")Exploration: How long are Hearthstone games? How many cards are played? How does the number of cards vary by Hero?
For a month's data, analyze the duration of games. Analyze the number of cards played and the number of cards played for each Hero.
Note, ascertaining the number of cards played by each Hero takes a bit of work. For this part, it is sufficient to you analyze the cards played by either player in a game with each type of Hero.
You may find some duration values to be null. These games should be ignored for this section. You should report how many such games are removed and/or the total games used in the duration computations. This kind of culling (i.e., removing some of the data) is often called "data cleaning" and is common in data analytics of all kinds.
Hint: The function len() can be used to print the length (i.e., number of items) in a Python dictionary.
cards_played = print( len(data['games'][5]['card_history']) )Hint: The below code prints out the total cards each Hero played across all games. This might be a useful start for some analysis.
#!/usr/bin/python3

# Needed imports.
import json
import sys

FILE="change-to-your-file-name"  # e.g., 2019-03-15.json

## Count total cards for all games by each hero

# Open file.
filename = FILE
data = json.load(open(filename))

# Setup dictionary.
played = {}

# Loop through all games.
total_games = data['total_games']
for game in data['games']:

  # Get hero. If new hero (not yet seen), initialize count.
  hero = game['hero']
  if hero not in played:
    played[hero] = 0

  # Loop through all cards in this game.
  for card in game['card_history']:
    if (card['player'] == 'me'):
      played[hero] = played[hero] + 1

  # Note, you can do same as above for opponent!

# Print total cards for each hero.
for hero in played:
  print("hero: ", hero)
print("played cards: ", played[hero])Exploration: Think of some Hearthstone exploration you would like to do. Consider the gameplay itself, the data available and possible use of the outcome.
Options include, but are not limited to:
Hint: Fields that might be of interest are: hero_deck, opponent_deck, mode, rank and user_hash. There may be others. To print, for example, the user_hash for the 3rd game:
print(data['games'][3]['user_hash'])Hint: If doing an in-depth analysis of the cards, the command:
print(data['games'][5]['card_history'][2]['card']['name'])will print the name of the 2nd card in the 5th game.
If it is helpful for learning and debugging code, a json-formatted file with just one game is here:
This file is formatted with indentation to make it easier to read in an editor. You can use it to better understand the structure of the data files.
To "pretty-print" a JSON file to the screen, you might try the following script:
#
# pp.py - pretty-print json file.
#

# Needed imports.
import json
import sys

FILE="change-to-your-file-name"  # e.g., 2019-03-15.json

# Open file, parse and print!
filename = FILE
parsed = json.load(open(filename))
print (json.dumps(parsed, indent=2, sort_keys=True))
Many of the grading comments applied to previous projects (1 and 2) are general and pertain to Project 3 as well. You should review the comments made to your Project 1 and Project 2 reports and make sure not to incorporate needed changes into your Project 3 report.
For general guidelines, you should also check out:
Writeup a short report.
Include appropriate descriptions for your data set, pipeline and methodology.
For each other part of the project, provide a brief section on the analysis in clearly labeled sections.
Be sure to consider measures of central tendency and measures of spread, as appropriate.
All guidelines for presenting and describing charts should be adhered to.
The assignment is to be submitted electronically via Canvas by 11:59pm on the day due.
The submission is a report in PDF, named:
proj3-lastname.pdfwith your name in place of "lastname" above, of course.
To submit your assignment (proj3-lastname.pdf):
Open: IMGD2905-D19-D01
Navigate to:Assignments->Project 3
Click:Submit Assignment
Click:Choose File
Select the pdf file:proj3-lastname.pdf
Click:Submit Assignment
Important - you must click the Submit Assignment button at the end or your file will not be submitted!
When successfully submitted, you should see a message similar to:
Submission
- Submitted!
Apr 9 at 11:50pm
All accomplishments are shown through the report. The point break down does not necessarily reflect effort or time on task. Rather, the scale is graduated to provide for increasingly more effort required for the same reward (points).
Part 1 (Heroes) - 35% : Analysis of Hero selection and win rate.
Part 2 (The Coin) - 30% : Analysis of the impact of going first on win rate.
Part 3 (Duration+) - 20% : Analysis of game duration and cards played.
Part 4 (Choice) - 15% : Analysis of choice.
100-90. The submission clearly exceeds requirements. All Parts of the project have been completed or nearly completed. The report is clearly organized and well-written, charts and tables are clearly labeled and described, measures of central tendency and spread properly computed and explained, and messages provided about each Part of the analysis.
89-80. The submission meets requirements. Parts 1-3 of the project have been completed or nearly completed, but perhaps not Part 4. The report is organized and well-written, charts and tables are labeled and described, measures of central tendency and spread computed and explained, and messages provided about most of the analysis.
79-70. The submission barely meets requirements. Parts 1-2 of the project have been completed or nearly completed, and some of Part 3, but not Part 4. The report is semi-organized and semi-well-written, charts and tables are somewhat labeled and described, but parts may be missing. Measures of central tendency and spread may not be always computed or explained. Messages are not always clearly provided for the analysis.
69-60. The project fails to meet requirements in some places. Part 1 of the project has been completed or nearly completed, and some of Part 2, but not Parts 3 or 4. The report is not well-organized nor well-written, charts and tables are not labeled or may be missing. Measures of central tendency and spread may not be always computed or explained or may even be misused. Messages are not always provided for the analysis.
59-0. The project does not meet requirements. Besides Part 0, and maybe Part 1, no other part of the project has been completed. The report is not well-organized nor well-written, charts and tables are not labeled and/or are missing. Measures of central tendency and spread are missing of, if in place, are misused. Messages are not consistently provided for the analysis.
The comments below are in response to graded projects. They are not provided in any particular order.
Most reports had good mechanics on the charts, meaning they were clear, readable and had followed the guidelines for good charts avoiding common mistakes. Well done.
In addition, most reports had good textual analysis, explaining how to read the chart and having a concise, precise narrative leading to the narratives. Again, well done.
For some, the portmortem feedback on project 1 and portmortem feedback on project 2 comments still hold (e.g., mistakes on those project are still being made on this one). Those should be reviewed.
Do not use pie charts. There is (almost) always a better alternative. There is always an alternative.
Part 3 had a duration component also, meaning that the length of a Hearthstone game should have been analyzed. This is in addition to cards played per game, which also should have been analyzed. Combining this analysis provides a rate, the cards played over time, which gives a measure of a games' pace.
The duration units are in seconds. As is often the case for raw data, this is not necessarily the units that are easiest for users to understand. Reporting the average game length is 1426 seconds is awkward, whereas reporting it as 23.8 minutes is easier to understand.
A significant part of many data analytics projects is cleaning the data. This can mean removing data observations that don't fit the initial criteria, for whatever reason. For this project, for most months of data, some of the duration fields are null. These need to be treated separately when analyzing durations, probably removing them. The alternative is to treat them as "0" values. Whatever is done, should be detailed in the report, with a description of what is removed.
Remember, in any data analytics report, you should say something about the origins of the data you are analyzing. For this project, a quick mention of Collect-o-Bot (and maybe Track-o-Bot) is appropriate, with a Web link. Specifically, however, you need to indicate what month you analyzed (e.g., March 2018). Also, provide some summary statistics about the data (e.g., number of games).
Generally, the report should briefly motivate the exploration before digging in with details. For this report, for Part 4, this means providing a quick motivation as to why you are doing this exploration. e.g., exploring Champion popularity each month to see if it changes with time.
Remember, main messages should be readily observable in your chart. For example, if your message is that the Paladin wins more going second than the Hunter, make sure this can be easily seen. If it is not, consider alternate analysis that makes this clear!
When reporting a measure of central tendency, you (almost) always want to report a measure of spread, too. Probably, this should be in chart form (e.g., CDF or Box and Whiskers or error bars) but could also be in a table (e.g., report the standard deviation).
For Part 2, the effect of the Coin isn't particularly noticeable in comparing games won with to games won without. Instead, a better way of judging the effect is to compare the win rate with the coin to the win-rate without - better, subtract the two so you have a small, few percent most likely difference. Draw a graph of those for all.
Do not necessarily stick with the first chart you make. For example, for part 1, gathering the number of games won for each Hero and plotting them as a column chart is like not the best way to analyze this data.
 Return to the IMGD 2905 home page