Search information retrieved from the altavista.digital.com search site is modeled in 3d using VRML. In order to model the heirarchical data, a cgi-bin program was written to extract the relevant information from the HTML code. This data is then used to generate a VRML file which can be loaded to interactively visualize the search information criteria.
Recently, digital added a new feature on its altavista web site. Called live topics, it allows the users to see the relationships between the users search criteria and other appropriate topics that could be used to narrow the search. For example, if you did a search on "global warming", live topics would show you the relationships between global warming, the greenhouse effect, and CFCs. However, the display of the information is two dimensional and visually unapealling. This project set out to improve on live topics and present the relationships between search topics in a more visually appealing and informative manner.
It was necessary to decide in what manner the topic relationships should be visualized. in "Cone Trees: animated 3d Visualizations of Hierarchical Information" by Robertson, Mackinlay, and Card, a method for viewing heirarchical information was developed. The basic premise of cone trees is that 2 dimensional representations are too limiting for large data sets.
Cone trees are presented in a virtual room with the top of the heirarchy at the ceiling. Children of the root node are spaced evenly along the base of the cone. These children in turn become root nodes for their children. Note that the diameter of the cone becomes smaller as the heirarchy grows larger because of the constraints of a virtual room. The body of each cone is shaded transparently so the cone does not block the view of other cones.
The main advantage of cone trees is that as the branching factor increases, the tree stays relatively small in width. Compared to normal 2 dimensional trees which grow very large as depth increases, Cone trees are an attractive alternative. Cone trees also grow in depth which two dimensional trees can not.
The following is a sample cone tree:

Image courtesy of Digital
Next, live topics establishes relationships between all of the categories. Again, as in the case of "global warming", the warming category has relationships with Fossil, Climatic, methane, atmospheric, and deforestation. Not all categories have links to other categories; some are seperate and do not have any connections. Note that the algorithm for determining this links is NOT published by digital and probably is regarded as proprietary information.
Now that you know about Cone Trees and the Live topics heirarchical information, how can they be mixed? Well, the answer is that they really do not. Cone Trees are very depth intensive by nature and the live topics links are not. For instance, not all of the categories in live topics are rooted at a single node. In fact, usually their are two or more seperate trees returned by live topics that do not have any links between them.
Because the live topics heirarchy is very broad, I did not feel comfortable with adopting a pure cone trees approach. Simply, the live topics data does not fit into the paradigm. However, from live topics you can construct a tree based on the links between categories and the relevance of each category. In the "global warming" example, the warming category can be construed as the root of a tree because it has a high relevance to the original search query. The links from the warming category can either be construed as children or as peers. A category would be considered a child if it had a lower priority; a peer if it had the same priority.
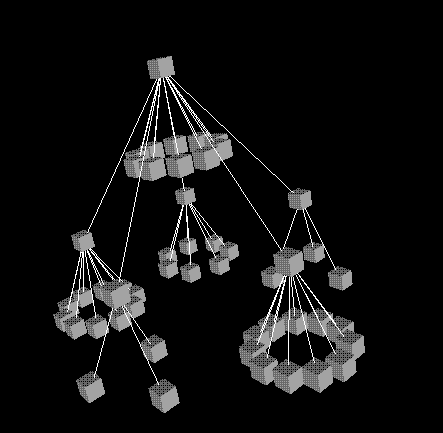
Because each node may have peers, the tree can grow very broadly. While this is not desireable from the point of a cone tree, we are limited by what data we can get from livetopics. However, we still use the concept of a "cone" to display the heirarchy between a title category and the nodes in that category. For example, the title of the category is the top of the cone and the children are aranged around the base. The following picture is an image of a simple cone. Note that there are not any line connections between the root and the children outlining the shape of the cone.

The next step in developing the visualization was to design how the
children categories would be displayed. Again, a large cone tree was developed with a larger radius. Using the same algorithm to generate the cone for a single category, we generate a children cone. Then we generate a category cone for every child. This approach yields the following visualization:

However, since children nodes can in turn have their own children, we
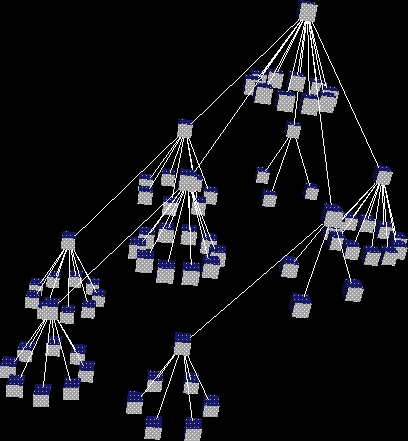
also need to draw these cones. Using a recursive data set, we draw all category cones and children cones until we can find no more links. This process yields a heirarchical tree in the following image:

The last step is to draw peer nodes. This process entails going back
to highest priority category and drawing all peer nodes. This process
recurses throughout the different priorities until all nodes are
drawn. Note that peer nodes either radiate out from a cone or are
drawn seperately. For instance, in the following image you can see
peer nodes that are unconnected to any other node (they have no links)
and peers nodes that are drawn in the same plane as the base of a
cone. Lines then connect the peer to the node they have a link to.

Up until this point, all of the nodes have been represented by a cube.
In order to differentiate the difference between the category title
nodes and the category children nodes, the shape of the title node was
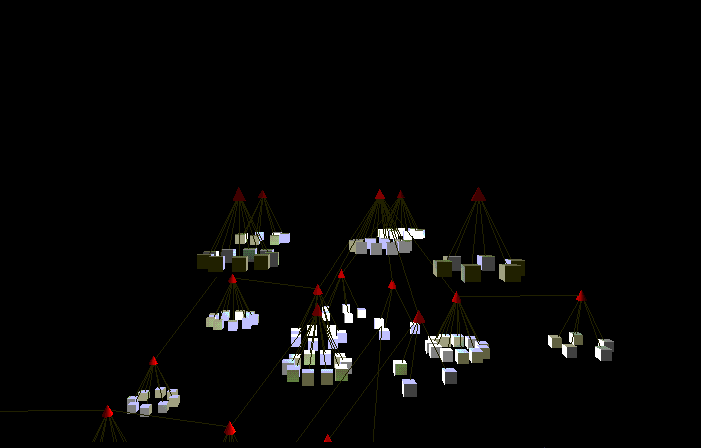
changed to a cone. In the next picture, the cone was shaded a varying
degree of red. The bright red indicated the category was very
important while a dark red indicated less relevence. This was not
very successful because it is hard for the eye to differentiate
between different shades of the same color. Note that a spotlight was
placed right below each category node. This was done to illuminate
the children at the bottom of the cone.

In order to differentiate between priorities, each priority (between 0
and 9) was mapped to a color. 0-2 is a shade of blue, 3-5 a shade of
green, and 7-9 a shade of red. For instance, priority 7 is 50% red, 8
is 75% red, and 9 is 100% red. Each category title node and child
node is shaded by priority. The final version of the VRML generator
implements this shading pattern for all nodes.
first vrml example
second vrml example
third vrml example
fourth vrml example
final version example
To see a real live version of the project, enter a search query in the box. The program will get the results from altavista and generate the appropriate VRML code. If you have a VRML browser, this should display the visualization. Note that the cgi-bin file may not always be working on the machine where this document eventually gets placed.
There are many possible direction to take this visualization of livetopics results. When VRML browsers start to support the text node, it would be nice to display the actual text above or near the node. Another area for exploration would be changing the tree display and mapping of priority to color values. More experimentation with the lighting model could also yield some interesting affects. Finally, use of the VRML anchor node would allow users to click on a node and then go back to altavista or generate another visualization.
Source code is available from here. Feel free to modify the code as long as you reference the original author.
Robertson, G., Mackinlay, J., Card, S. "Cone Trees: Animated 3D Visualizations of Hierarchical Information". Conference Proceedings of the ACM Sig Computer Human Interfaces, 1991. 189-194.