Flow Visualization
Dr. Matthew O. Ward
Computer Science Department
WPI
Introduction
Flow visualization is the study of methods to display dynamic behavior in liquids and gases. The field dates back at least to the mid-1400's, where Leonardo Da Vinci sketched images of fine particles of sand and wood shavings which had been dropped into flowing liquids. Since then, laboratory flow visualization has become more and more exact, with careful control of the particulate size and distribution. Advances in photography has also helped extend our understanding of how fluids flow under various circumstances.
More recently, computational fluid dynamics (CFD) has extended the abilities of scientists to study flow by creating simulations of dynamic behavior of fluids under a wide range of conditions. The result of this analysis is usually a 2-D or 3-D grid of velocity vectors, which may be uniformly or non-uniformly spaced. The goal is then to analyze this vector field to identify features such as turbulence, vortices, and other forms of structure.
There are several variations on the structure of the field data which is generated by these experiments. A static field is one in which there is only a single, unchanging velocity field. Time-varying fields may either have fixed positions with changing vector values or both changing positions and changing vectors (for example, when modeling rotating turbine blades or pitching airfoils). These latter types are refered to as unsteady.
Definitions
Mathematics of Particle Advection
Below is the pseudo-code for computing streaklines in the most general situation, namely where both vectors and grid positions for the field may be changing over time (derived from Lane, 1994).
Assume there are ![]() seed locations and
seed locations and ![]() time steps. Thus there
will be s traces, each with a varying number of particles. Each iteration
of the outermost loop will compute new positions based on the current time
and next time, thus requiring 2 time steps of flow and grid position data.
After each iteration, the next set of flow and position data is read. This
procedure looks as follows:
time steps. Thus there
will be s traces, each with a varying number of particles. Each iteration
of the outermost loop will compute new positions based on the current time
and next time, thus requiring 2 time steps of flow and grid position data.
After each iteration, the next set of flow and position data is read. This
procedure looks as follows:
Read first 2 time steps of flow and grid data
For t = 1 to Nt-1 do
   Advect_trace(t, t+1)
   Write curent traces to file
   Read next time step of flow data
   If moving grid, Read next time step of grid data
   End for
For each time step, we look at each trace and each particle within the trace. We compute a new position for each particle, and if it is still within the region associated with the field, we save it. Finally, we start a new particle at the seed location for each trace.
For s = 1 to Ns do
   Copy trace s to working trace w
   W_length = Trace_length(s)
   Clear trace s and set Trace_length s to 0
   for i = 1 to W_length do
      p = ith particle of working trace w
      advect_particle(current_time, next_time, p)
      if p within field space
         store p in trace s
         Trace_length(s)++
         End if
      End for
   Release a new particle for trace s at the seed location
   Trace_length(s)++
   End for
To advect a particle between two time periods, we need to integrate the point position in small step sizes until either the position falls out of the field space or the ending time is reached. This is usually done using a Runge-Kutta integration based on a predictor-corrector algorithm. This requires a trilinear interpolation of the vector field to compute the velocity at an arbitrary location. The following shows a second-order integration.
t = current_time
While (t < next_time AND p inside field) do
   V = Interpolate_velocity(p, t, current_time, next_time)
Adjust:
   h = c/max(V)    /* C is a step size between 0 and 1 */
   If (t + h > next_time) h = next_time - t
   t = t + h
Predict:
   p_approx = p + h * V
   V_new = Interpolate_velocity(p_approx, t+h, current_time, next_time)
Adapt_step:
   V_total = (V + V_new)/2
   if (h * max(V_total) > c) then
      V = V_total
      t = t - h
      Goto Adjust
      End if
Corrector:
   p = p + h * (V + V_new)/2
   End while
Visualization Techniques
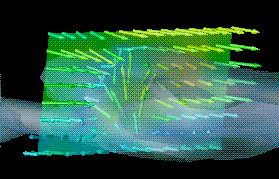
The simplest form of flow visualization is to display the velocity field data itself, either as displacement vectors using such things as arrow glyphs or magnitude scalar values using image, surface, or volume visualization techniques (mapping values to color, size, or position).

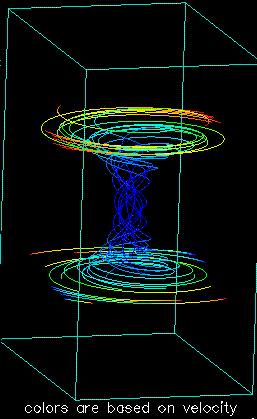
The next most common technique is the generation of streamlines based on a static velocity field. The user selects seed locations (often along a line or at 2-D grid locations), and computes a path for each see point through the field, maintaining a continuous tangent to the flow field.

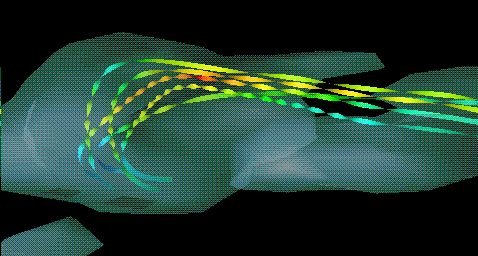
Besides using lines to indicate the streams, we can use planar or solid objects, such as ribbons and tubes. Other attributes of the field, such as magnitude or vorticity, can now be mapped to other attributes of the stream-ribbons or stream-tubes, such as color, size, or twist.


Streaklines are often represented as a continuous stream of particles emanating from a discrete set of points and flowing through the field. Individual points in a given trace (all particles coming from a particular location belong to the same trace) may be identified by color-coding to help distinguish related points which get separated when entering areas of high velocity (see video).

One recent technique for flow visualization is called a streamball, which is based on the use of metaballs or blobby/soft objects. This is an implicit surface based on a field created by computing the influence of seed points on each location in the field. In effect, each seed point will influence a certain part of space, and locations in space can be influenced by multiple points. What this means is that if we use each particle along a streamline or streakline to influence a spherical segment of the field, locations under the influence of multiple particles will have continuous, smooth transitions from one particle to the other. This can form both tubes and surfaces, depending on how close the particles and streamlines are to each other (see video).
References
All images are courtesy of IBM, generated via IBM Visualization Data Explorer using the sample data sets provided with the software.
Aref, Hassan, Charles, Richard D., and Elvins, T. Todd, "Scientific Visualization of Flow," in Frontiers of Scientific Visualization (Clifford A. Pickover and Stuart K. Tewkesbury, eds.), John Wiley and Sons, New York, 1994.
Brill, Manfred, et. al., "Streamballs Techniques for Flow Visualization", Proc. Visualization '94, pp. 225-231, October, 1994.
Lane, David A., "UFAT - a Particle Tracer for Time-Dependent Flow Fields", Proc. Visualization '94, pp. 257-264, October, 1994.
matt@owl.WPI.EDU