Processing data in files TYPEPERF*.csv
Contents
Preliminary Setup
useful Matlab commands: datestr, datenum
clear, close, clc
% Modify the original data in the files TYPEPERF*.csv to into a format compatible with Matlab
% see slide 31 (Data Preparation); save the modified files as typeperf*M.csv
files={'typeperf1M.csv', 'typeperf2M.csv'}; % a list of modified files
fig1=10; % just the figure number
colorPlot={'-dr', '-sg', '-*b', '-om', '-dk'}; % line properties (color, markers) for multiple plots;
Import, Process and Plot Data
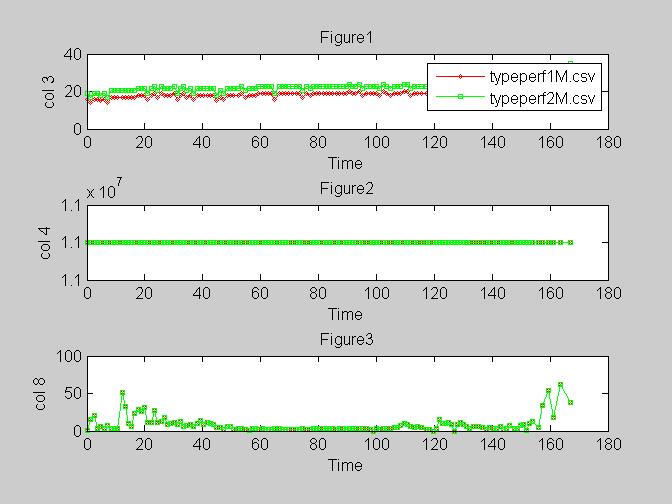
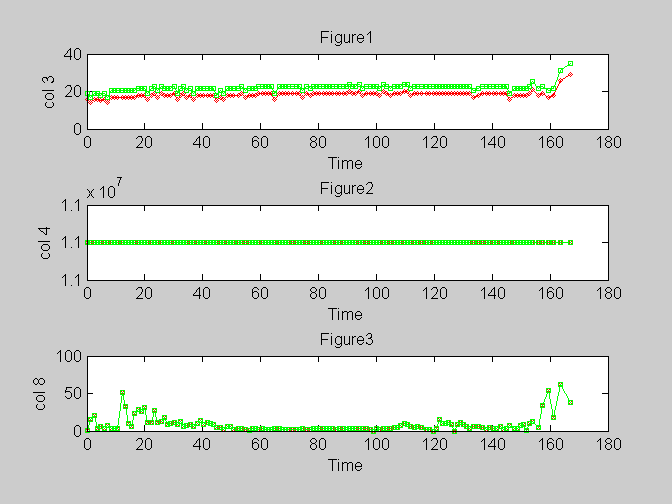
for i=1: size(files,2)

    fileName=files{i};
    A = importdata(fileName); % load data into a structure

    dataExp=A.data; % numerical data
    timeDate=A.textdata(2:end,1); % time data
    timeUTC=datenum(timeDate); % transform time to UTC
    relUTCTime=timeUTC-timeUTC(1); % define relative time
    T=datestr(relUTCTime, 'MMSSFFF'); % time in minutes, seconds, miliseconds
    time=str2num(T(:,1:2))*60+str2num(T(:,3:4))+str2num(T(:, 5:7))/1000; % convert time in seconds

    figure(fig1);  % open the figure fig1
    subplot(3,1,1); % divide the figure in two windows
        plot(time,dataExp(:,2), colorPlot{i}, 'MarkerSize',3);
        xlabel('Time'); ylabel('col 3');title('Figure1');
        hold on
    subplot(3,1,2)
        plot(time,dataExp(:,3), colorPlot{i},'MarkerSize',3);
        xlabel('Time'); ylabel('col 4'); title('Figure2');
        hold on
    subplot(3,1,3)
        plot(time,dataExp(:,7), colorPlot{i},'MarkerSize',3);
        xlabel('Time'); ylabel('col 8'); title('Figure3')
        hold on
end
Add legends
figure(fig1)
subplot(3,1,1); legend(files)