Processing data in files logFile*.csv
Contents
Preliminary Setup
clear, close, clc

% 1. prepare the files so that they can be processed in Matlab (see PPT
% slide 38). Save the files as logFileM*.csv
files={'logFileM1.dat','logFileM2.dat'}; % list of the files to be downloaded
fig2=20; % just the figure number
colorPlot={'-dr', '-sg', '-*b', '-om', '-dk'}; % line properties (color, markers) for multiple plots;
Import, Process and Plot Data
for i=1: size(files,2) % size(files,2) gives the number of files in the structure <<files>>
    fileName=files{i}; % current file
    dataExp=dlmread(fileName, '', 1, 0); % read the fileName starting with row 1, column 0; Row 0 is the header;
    timeUTC=dataExp(:,1); %  time in UTC format is the first column of the matrix dataExp
    relTime=timeUTC-timeUTC(1); % relative time, relTime(1)=0;
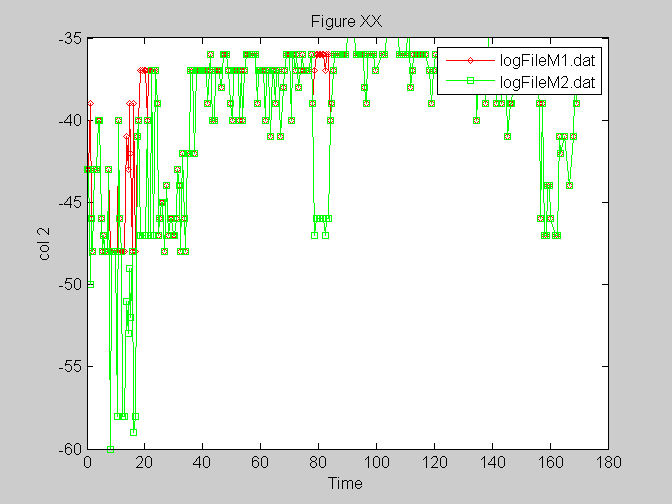
    figure(fig2)
    plot(relTime,dataExp(:,2), colorPlot{i}, 'MarkerSize',4); % plot data in column 2
    xlabel('Time'); ylabel('col 2');title('Figure XX'); %!! change the title of the figure
    hold on; %  plot multiple graphs in the same figure
end
legend(files); % legend('signal1', 'signal2')
