![Figure 1. Part of a real teacher report [5], showing students’ (with fake names) “expected” MCAS scaled score (circled on the screen shot) based upon their performance only on the original questions.](p1099-feng_files/image001.jpg)
Figure 1. Part of a real teacher report [5], showing students’ (with fake names) “expected” MCAS scaled score (circled on the screen shot) based upon their performance only on the original questions.
There is a large interest in "Formative Assessment" in K-12 Education [11] with many companies [1]providing such services. However, the limited classroom time available in middle school mathematics classes compels teachers to choose between time spent assisting students' development and time spent assessing students' abilities. To help resolve this dilemma, assistance and assessment are integrated in a web-based e-learning system ("ASSISTment"[2]) that will offer instruction to students while providing a more detailed evaluation of their abilities to the teacher than is possible under current approaches. Traditionally these two areas of testing (i.e. Psychometrics) and instruction (i.e, math educational research and instructional technology research) have been separate fields of research with their own goals. The US Dept of Education funded us to build a web based e-learning system that would also do e-assessment at the same time. This paper is focused on reporting how well the system does in assessing, and we refer to research by Razzaq, Feng, et. al (2005) for recent results on how students are learning within the system itself.
The ASSISTments project was funded to see if it was possible to do assessment better if we had online data including the amount of assistance students needed to learn to do a problem (how many hints, how many sections it took them, etc). At that time, we had no idea if we could accomplish this. This paper now reports the results of our analysis of the assessment value of our system. Specially, our research questions are:
Research Question 1a (which we will refer to as RQ#1a): Does the tutoring provide valuable assessment information? To answer this question we will compare the model built that considers only the original question response, and compare it to a model that adds in variable measures of the assistance the student needed to get the item correct. As shown in Figure 1, we have presented our prediction of students' "expected" Massachusetts Comprehensive Assessment System (MCAS) test scores as a single column in one of our online teacher reports [5], the "Grade Book" report. The prediction was made based only upon student performance on the original questions. The report does not distinguish between two students that both got the original question wrong, but then needed very different levels of tutoring to get the problem correct eventually. A positive answer to the research question would help us to build a better predictive model and also improve our online teacher reporting.
Research Question 1b (we will refer to this as RQ#1b): Does this continuous assessment system do a better job than more traditional forms of assessment? To answer this question we noticed that two of our cooperating schools want to give two paper and pencil practice MCAS tests during the year, so, among other things, students could get used to the way the test is given. We wanted to see if these two realistic practice sessions did a better job than our online system. Note that this comparison confounds total time during the assessment, but we argue that this is a fair test, by saying that schools are willing to use the ASSISTments often because they believe (and Razzaq et al have shown) students learn during the ASSISTments. However, the schools are not willing to use more valuable instruction time to test more often. In one sense, this comparison mirrors comparing a static testing regime, like the MCAS, to NWEA's MAPS[3] program (which the Worcester Public Schools recently spent half a million dollars to assess all students in 3rd grade to 10th grade in math and English twice a year). While at this time we do not have the MAPS data back yet associated with students' MCAS scores, this RQ#1b tests to see if a static testing regime is better than the ASSISTment system.
Figure 1. Part of a real teacher report [5], showing students’ (with fake names) “expected” MCAS scaled score (circled on the screen shot) based upon their performance only on the original questions.
Research Question 2a (we will refer to this as RQ#2a): Can we track student learning over the course of the year? This will include students' learning both in class and in the ASSISTment system. We speculate that teachers that use the ASSISTments reports will learn more about their students, and therefore make their classrooms more effective, and thus produce better learning. However, we will not know if this is true until we have run a randomized controlled study with 20 teachers in the control group and 20 teachers in the experimental group (we will be applying for funds to do this next year).
Research Question 2b (we will refer to this as RQ#2b): Can we see what factors affect student learning? Variables that immediately came to our mind are School, Teacher and Class. Our analysis result showed that using school as a factor helps to predict students' initial knowledge and also their rate of learning across time.
Research Question 2c (we will refer to this as RQ#2c): Can we track the learning of individual skills? To answer this question, our first step is to use the most coarse-grained model provided by Massachusetts that breaks all 8th grade math items into 5 categories. All items in the ASSISTment system have been fitted into one of the five strands. Results for this analysis will be provided in section 5.2. The project team has finished tagging items in the ASSISTment system using a much finer grained model with 98 skills. Our work on that will be continued after more data has been collected, which we hypothesize in turn can help justify our skill-tagging.
Research Question 2d (we will refer to this as RQ#2d): Can we track the learning of individual skills better if we use paper practice test results as a covariate? Paper practice tests appear to be well correlated with students' actual performance on the MCAS test (see section 4 for more details) so we hope to check if we can reach a better skill-tracking model by adding it as a covariate.
The more general implication from this research suggests that continuous assessment systems are possible to build and that they can be more accurate at helping schools get information on their students. We argue that this result is important because it opens up the ability to blend assessment and assisting. This seems to open up a whole new area of assessment that is contentious in nature so that students would have to spend little (or no) time on formal paper and pencil tests.
Next we will review some background literature on this topic.
Other researchers have been interested in trying to get more assessment value by comparing traditional assessment (students getting an item marked wrong or even getting partial credit) with a measure that shows how much help they needed. In Bryant, Brown and Campione [3], they compared traditional testing paradigms against a dynamic testing paradigm. Grigorenko and Sternberg (1998) reviewed relevant literature on the topic and expressed enthusiasm for the idea. In the dynamic testing paradigm, a student would be presented with an item and when the student appeared to not be making progress, would be given a prewritten hint. If the student was still not making progress, another prewritten hint was presented and the process was repeated. In this study they wanted to predict learning gains between pretest and posttest. They found that static testing was not as well correlated (R = 0.45) with student learning data as with their "dynamic testing" (R = 0.60) measure. Bryant et al suggested that this method could be effectively done by computer, but, as far as we know, their work was not continued. Luckily, the ASSISTment system provides an ideal test bed as it already provides a set of hints to students. So it is a natural way to extend and test this hypothesis and see if we can replicate their finding of ASSISTment-style measures being better assessors.
Figure 2. A student can log into the ASSISTment system via the web.
The ASSISTment system is an e-learning and e-assessing system that is about 1.5 years old. In the 2004-2005 school year some 600+ students used the system about every two weeks. Eight math teachers from two schools would bring their students to the computer lab, at which time students would be presented with randomly selected Massachusetts Comprehensive Assessment System (MCAS) test items. In Massachusetts, the state department of education has released 8 years worth of MCAS test items, totaling over 200 items, which we have turned into ASSISTments by adding "tutoring". If students got the item correct they were given a new one. If they got it wrong, they were provided with a small "tutoring" session where they were forced to answer a few questions that broke the problem down into steps.
The ASSISTment system is based on Intelligent Tutoring System technology that is deployed with an internet-savvy solution and developed based on the Common Tutoring Object Platform (CTOP) (for more technical details on the CTOP and the runtime of the system, see [9] [10]). The application is delivered via the web and requires no installation or maintenance. Figure 2 shows that via a web browser, a student typed in her user name and password and was ready to login to the ASSISTment system.
The key feature of ASSISTments is that they provide instructional assistance in the process of assessing students. The hypothesis is that ASSISTments can do a better job of assessing student knowledge limitations than practice tests or other on-line testing approaches by using a "dynamic assessment" approach. In particular, ASSISTments use the amount and nature of the assistance that students receive as a way to judge the extent of student knowledge limitations. Initial first year efforts to test this hypothesis of improved prediction of the ASSISTment's dynamic assessment approach are discussed below.
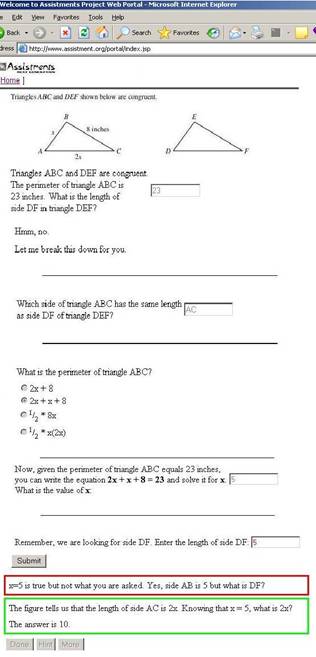
Figure 3. An ASSISTment shown just before a student hits the “Submit” bottom, showing two different hints and one buggy message that can occur at different points.
Each ASSISTment consists of an original item and a list of scaffolding questions (in the following case, 4 scaffolding questions). An ASSISTment that was built for item 19 of the 2003 MCAS is shown in Figure 3. In particular, Figure 3 shows the state of the interface when the student is almost done with the problem. The first scaffolding question appears only if the student gets the item wrong. We see that the student typed "23" (which happened to be the most common wrong answer for this item from the data collected). After an error, students are not allowed to try the item further, but instead must then answer a sequence of scaffolding questions (or "scaffolds") presented one at a time[4]. Students work though the scaffolding questions, possibly with hints, until they eventually get the problem correct. If the student presses the hint button while on the first scaffold, the first hint is displayed, which would be the definition of congruence in this example. If the student hits the hint button again, the second hint appears which describes how to apply congruence to this problem. If the student asks for another hint, the answer is given. Once the student gets the first scaffolding question correct (by typing AC), the second scaffolding question appears. Buggy messages will show up if the student types in a wrong answer as expected by the author. Figure 3 shows a buggy message (bordered in red) for the error input "5" on the 4th scaffolding question, as well as 2 hints (bordered in green). Given these features of the ASSISTments, if RQ #1b is correct, then we hypothesize that we should be able to learn a function that will better predict students' MCAS performance.
The teachers seemed to think highly of the system and, in particular, liked that real MCAS items were used and that students received instructional assistance in the form of scaffolding questions. Teachers also like that they can get online reports on students' progress from the ASSISTment web site and can even do so while students are using the ASSISTment System in their classrooms. The system has separate reports to answer the following questions about items, students, skills and student actions: Which items are my students finding difficult? Which items are my students doing worse on compared to the state average? Which students are 1) doing the best, 2) spending the most time, 3) asking for the most hints etc.? Which of the approximately 98 skills that we are tracking are students doing the best/worst on? What are the exact actions that a given student took? Database reporting for the ASSISTment Project is covered extensively in [5].
Currently about 1000+ students of 20 teachers from 6 schools in 3 towns are using the system for about one 40-minute class period every two weeks for the 2005-2006 school year.
Considerable time has been spent on observing its use in classrooms to work with teachers to try to improve content and to work with students to note any misunderstandings they sometimes bring to the items. For instance, if it is noted that several students are making similar errors that were not anticipated, the "ASSISTment Builder" [16] web-based application can be logged into and a buggy message added that addresses the students' misconception.
The current ASSISTment System web site is at www.ASSISTment.org, which can be explored for more examples.
For the school year of 2004 to 2005, we collected an integrated dataset of 417 students who have been using the ASSISTment system from September 2004. Though more than 600 students were using our system in the past school year as mentioned above, we were only able to collect integral data for these 417 students as MCAS scores and/or paper practice test results of the rest of the students were missing. The dataset is built in the format of one row per student, with columns being their actual MCAS raw score[5], paper practice test result, and a collection of online measures derived from the computer (% correct on items, average number of hints needed, etc.). A student's raw MCAS score is out of 54 points, where each multiple choice or short answer question correct will earn the student a point and a full correct answer to open response questions[6] will earn 4 points. The two paper practice tests, which we will refer to as Sep-test and March-test, were administered in September 2004 and March 2005. Students were asked to finish them in two periods over two days. These students have practiced mathematics problems in the ASSISTment system for a mean length of 256 minutes across about 9 sessions, finishing on average 140 items. From log data, we created a single file with one row per student and their associated real MCAS score, the student paper and pencil test scores, and 15 "online measures" which we think indicate the amount of assistance a student needs to get an item correct. These online measures are:
The ten measures from HINT_REQUEST_COUNT to AVG_ITEM_TIME in above list are generally all ASSISTment style metrics, which indicate the amount of assistance students need to finish problems and the amount of time they spend to finish items. Therefore, we hypothesize all these measures would be negatively correlated with MCAS scores.
Among these measures, "ORIGINAL_PERCENT_CORRECT" is a static metric that mimics paper practice tests by scoring students as either correct or incorrect on each item, while the rest of the measures are dynamic assessment metrics that measure the amount of assistance students need before they get an item correct.
We have been presenting some of these online measures in our reports to teachers (See Figure 1). Particularly, student Mary used the system 4 hours and 17 minutes, finished 114 items with 20% correct. She went through 356 scaffolding questions with 20% correct and asked for 705 hints, which is enormous compared to her classmates. And as we discussed above, asking for too many hints had a negative impact on her online performance.
Given the data set, our goal was to see if we can reliably predict students' MCAS scores and to evaluate how well on-line use of the ASSISTment System, in addition to pretest and posttest, can help in the prediction. To achieve the goal, we did stepwise linear regression using paper practice test results together with the online measures as independent variables to predict students' MCAS scores.
First of all, we present the Pearson correlations between MCAS scores and all the independent variables in Table 1 to give some idea of how these factors are related to MCAS score. All these factors turned out to be significantly correlated with MCAS score (p < .05, N=417) Particularly, the correlations between the two online measures ORIGINAL_PERCENT_CORRECT and PERCENT_CORRECT and MCAS score are 0.753 and 0.763, even higher than the correlation between SEP-TEST and MCAS score (actually, 0.745). Though the assessment time in the ASSISTment system is far more than the time students spent on paper practice tests (236 vs. 120 minutes), which makes this comparison unfair, these numbers reflected the prediction power of the ASSISTment system on the paper-based MCAS test.
Table 1. Correlations
| Factors | MCAS | ||
|---|---|---|---|
| Paper practice tests | SEP-TEST | 0.745 | |
| MARCH-TEST | 0.406 | ||
| Online Computer Metrics |
Static metric | ORIGINAL_PERCENT_CORRECT | 0.753 |
| Attendance | ORIGINAL_COUNT | 0.47 | |
| TOTAL_MINUTES | 0.258 | ||
| Assistance Style Metrics (dynamic metrics) |
PERCENT_CORRECT | 0.763 | |
| QUESTION_COUNT | 0.196 | ||
| HINT_REQUEST_COUNT | -0.414 | ||
| AVG_HINT_REQUEST | -0.632 | ||
| HINT_COUNT | -0.393 | ||
| AVG_HINT_COUNT | -0.625 | ||
| BOTTOM_OUT_HINT_COUNT | -0.375 | ||
| AVG_BOTTOM_HINT | -0.546 | ||
| ATTEMPT_COUNT | 0.081 | ||
| AVG_ATTEMPT | -0.411 | ||
| AVG_QUESTION_TIME | -0.118 | ||
| AVG_ITEM_TIME | -0.391 | ||
We then ran stepwise linear regression analysis with Probability-of-F-enter <= 0.05 and Probability-of-F-remove = 0.1 to predict MCAS scores. In Table 2, we summarize the five models that have been built for which we selected different groups of independent variables (IV) for regression. For all these models, we saw normally distributed standardized residuals.
RQ#1a can be answered by comparing model II and model III. As we show in table 2, in model II, only response for original item was included while we introduced assistance measures in model III. Model III, by allowing all online measures to enter the model, took into account students' performance on both original items and scaffolding questions. Variables entered model III in the following order: PERCENT_CORRECT, AVG_ATTEMPT, AVG_ITEM_TIME, AVG_HINT_REQUEST and ORIGINAL_PERCENT_CORRECT. Among these variables, PERCENT_CORRECT, associated with positive coefficient, and AVG_ATTEMPT, AVG_ITEM_TIME, AVG_HINT_REQUEST, associated with negative correlation coefficients, were considered more significant since they entered the final model earlier than the static metric. These dynamic metrics reflected students' performance on scaffolding questions and also how much assistance they needed to solve problems. Interpretation of these variables is straightforward: the more attempts, more time, more hints students need, the lower students' knowledge level would be. Given the increase of R2-adjusted from 0.566 in model II to 0.659 in model III, we claim that the tutoring does provide valuable assessment information.
We want to render the answer to RQ#1b by examining the difference between model I and model III. For model I, Sep-test and March-test results were used together to predict MCAS scores and we got R2-adjusted being 0.586, 0.07 lower than that of model III. This result provides a positive answer to RQ#1b: the continuous assessment system is able to do a better job than more traditional forms of assessment given a reasonable period of time.
Given the fact that model I and model II are not nested, besides R2-adjusted, we calculated Bayesian Information Criterion (BIC) of both models to compare the two models, using the formula for linear regression models introduced in Raftery (1995):
![]()
where
n: the sample size, in our case, n = 417
log: natural logarithm
p: the number of independent variables included in each model
It turned out that BIC of model I (R2 = 0.588) is about 15 points lower than that of model II (R2 =0.567). This led us to conclude that model I is statistically better than model II[8] [12], which means though finished in limited time, paper practice tests have done a decent job predicting students' knowledge while online metrics required more time to do as well (or better). Our speculation is that this can be attributed to the following factors: 1) the ASSISTment system always allows students to ask for hints, which to some degree prevented students from trying their best to give a solution. Since we treated hint requests as false responses to questions, this feature could impact students' evaluation. 2) Students' attitude towards computers affects their performance on computer-based tests [2]. The availability of ASSISTment usage survey results made it possible for us to verify this speculation in the near future. 3) Students may tend to treat paper-and-pencil practice more seriously than computer-based practice.
Table 2. Regression Models
| Model ID | Independent Variable's | # Variables Entered | R2-adjusted | BIC |
|---|---|---|---|---|
| Model I | Paper practice results only | 2 | 0.586 | -358 |
| Model II | The single online static metric of percent correct on original questions | 1 | 0.566 | -343 |
| Model III | Model II plus all other online measures | 5 | 0.659 | -423 |
| Model IV | Model I(paper and pencil tests) and Model III (includes all online metrics) | 6 | 0.709 | -484 |
| Model V | Paper practice results, online measures plus quadratic and 2-by-2 interactions between entered variables in Model IV | 10 | 0.733 | -499 |
Since both traditional paper practice and online measures showed some prediction power, we expected that a combinatorial model would do better. Model IV combined the effect of paper practice tests and online measures. With 6 variables (1 more than in model III), it gained a 0.05 increment on R2-adjusted value and 61 points lower on BIC value, which means model IV is significantly better than the previous models. Variables entered in model IV and their coefficients are given in Table 3. Notice that given Sep-test and March-test, the static metric was not significant anymore while the dynamic measures still were.
Table 3. Coefficients of Model IV
| Order | Variables Entered | Coefficient | Standardized Coefficient |
|---|---|---|---|
| 1 | PERCENT_CORRECT | 27.343 | 0.351 |
| 2 | SEP-TEST | 0.450 | 0.303 |
| 3 | AVG_ATTEMPT | -8.508 | -0.151 |
| 4 | MARCH-TEST | 0.473 | 0.121 |
| 5 | AVG_ITEM_TIME | 0.021 | -0.081 |
| 6 | AVG_HINT_REQUEST | -2.444 | -0.122 |
The interpretation of Table 3 is straightforward:
Quadratic terms and interactions between factors were introduced when building model V to check if a non-linear relationship exists. We were able to train a more complicated model which is statistically better than model IV. Though BIC of model V is 15 points lower than that of model IV, we declare that model IV is our preferred model for MCAS score prediction with regard to the fact that variables in model V almost doubles that of model IV.
It is suspected that a better job of predicting MCAS scores could be done if students could be encouraged to take the system seriously and reduce "gaming behavior". One way to reduce gaming is to detect it [1] and then to notify the teacher's reporting session with evidence that the teacher can use to approach the student. Our preliminary work on gaming detection was presented in [6]. It is assumed that teacher intervention will lead to reduced gaming behavior, and thereby more accurate assessment, and higher learning. Adding visual feedback, as one ongoing work in the ASSISTment system does, aims to help teachers quickly detect gaming behaviors.
The project team has also been exploring metrics that make more specific use of the coding of items and scaffolding questions into knowledge components that indicate the concept or skill needed to perform the item or scaffold correctly [14]. Better and more efficient ways to use student data to help in the coding process are being sought out. It is believed that as more data is collected on a greater variety of ASSISTment items, with explicit item difficulty designs embedded, more data-driven coding of ASSISTments into knowledge components will be possible.
In Razzaq et. al (2005) we reported results that suggested students were learning directly during the assisting. We did this by looking at groups of items that had the same skills and looked to see if performance later in the class period was associated with high performance. The approximately 2% average gain score over all of the learning opportunity pairs suggests that students were learning in the system. In this paper, instead of discussing within-system learning, we focus on tracking students learning in class over a long period of time.
Recall that RQ#2a brought up the question whether we can track student learning over the course of the year. To investigate this question, we did a longitudinal analysis on the ASSISTment data to investigate if learning happens over time. We gradually introduced factors such as what school they are in, who their teacher is, or which class they are from into our models. By doing so, we attempt to provide an answer to RQ #2b: what factors impact (or are correlated with) students' learning rate. Our effort on answering RQ#2c and RQ#2d are discussed in section 5.2, in which students' learning was split into 5 categories based on skills involved in the items they had finished and student Sep-test result were then introduced as a covariate into the models. We found some evidence showing we were able to track skill learning and Sep-test is a significant factor when predicting student's knowledge across time.
We chose to build from our data set a set that had one row per student for each time they used the ASSISTment system. Each row represents a day they came to the lab. Our data set has more students than the one from above because we did not need to have students that had taken both paper practice tests. The data set contains data from students of the same 8 teachers from 2 schools, teaching a combined total of 31 mathematics classes. Rather than treating time as days from the beginning of the year, we collapsed all data in a given month and used month as the level of granularity to measure time in, and called them "CenteredMonth" since the months are centered around September 2004. We excluded data from September, 2004 from our data set, taking into account the fact that students were learning how to use the ASSISTment system when they first came to the labs in September, 2004. This makes CenteredMonth run from 1 for Oct., 2004 to 9 for June, 2005. Our final "person-period" structured data set contains 841 students and on average 5.7 data waves for each of them. Students' percent correct on the original items was treated as an outcome whose values change systematically over months. To mimic the real MCAS score, we multiply percent correct by 54 (the full MCAS score). This makes the range of the outcome change to 0~54. The outcome will be referred to as PredictedScore from now on.
We followed the standard method of performing longitudinal data analysis (Singer and Williet,2003) fitting a mixed effect (fixed effect plus random effect) model that simultaneously builds two sub-models, in which level-1 sub-model fits within-person change and describes how individuals change over time and level-2 sub-model tracks between-person change and describes how these changes vary across individuals.
We fit a regression line for each individual student before applying a mixed effect model and ended with a mean slope of 1.46 points per month. This positive trajectory slope was considered as the initial evidence that students learned across time. We then planned to build a series of mixed effect models of increasing complexity that would progressively add components for tracking learning over time, and then add parameters for schools, teacher and classes as shown in Figure 4.
We started by building an "unconditional means model" with no predictors, which had a BIC of 31712. This model is called "unconditional" because there are no predictors so that it won't describe change in the outcome over time. Instead, it "simply describes and partitions the outcome 'variation'." [15] This model serves as a baseline by which to evaluate subsequent models. The unconditional means model showed us that the estimated overall average on initial PredictedScore is around 24 points and the estimated variance of intercepts and the estimated variance of residual are both large and statistically significant (p < 0.05). This can be interpreted as students' PredictedScore varies over time and students differ from each other on their performance, and there is sufficient variation at both levels to warrant further analysis.
We then compared the above model with an "unconditional growth model", in which we introduced "CenteredMonth" as a predictor TIME. This new model double circled in Figure 4 predicted that the estimate of students' average PredictedScore in October, 2004 is about 18 and the average slope is 1.29, which means after each month, the average PredictedScore increases by 1.29 points. To get more sense out of this number (1.29), we compare this predicted average monthly increase with the improvement required in MCAS test. In MCAS test, students' raw score is out of 54 and their performance is evaluated at 4 levels: warning, need improvement, proficient and advanced. To "jump" from warning to proficient, which is the aim of most students, raw score needs to increase from 23 to 35 and the difference 12 is about 22% of the full score. Distributing the difference across 9 months gives monthly improvement of about 1.33 points, which is slightly higher than the monthly increase predicted in our analysis. The growth model was statistically better having a BIC that is lower by 84 BIC points, which led us to conclude that time is an important factor and also gave a positive answer to RQ#1a.
Figure 4. Series of longitudinal models for tracking learning
The covariance parameters of the model showed that initial knowledge varies significantly between students after controlling for time (p < 0.05) and the knowledge changing rate varies significantly between students. Since the level-2 (i.e. between-person) variance components quantify the amount of unpredicted variation in the individual growth parameters (i.e. initial knowledge and rate of change), the significance of the variance indicates there could be other factors we can introduce as level-2 predictors to explain the heterogeneity in each parameter.
We then introduced new factors to build three new models, with each containing one of the school (as in Model D), teacher (as in Model E) or class (as in Model F) variables. The schools model showed a statistical significant advantage. For schools there was a clear difference in incoming students' scores, which makes sense with regard to the fact that one school draws students from the more affluent side of town. The difference in slope parameter of schools was near significance (p=0.09) and suggested that one school caused more learning in students then another. In contrast to model D, neither model E nor model F displays statistically significant improvement over model B. Our speculation is that class may be a level too low to investigate difference on learning, noticing that model F contains 70 parameters that will draw a big increment on BIC values. And a similar problem may associate with model E, which contains 20 parameters.
These results show that the ASSISTment system can reliably track the fact that students are learning in their classes over time. This means that the ASSISTment system can be useful to track and evaluate different interventions. According to these results, not all considered factors (School, Teacher and Class) are significant and we saw only that the ASSISTment system detected different rates of learning at different schools.
More work is needed to build models to better be able to detect differences between teachers' effects on the learning rates of students that presumably exist. Besides, other factors will be investigated about their possible impact on students' learning over time. Information from student profiles such as gender, race and ethnicity, special education status, free-lunch status, etc., is in our consideration. During this analysis, we noticed the fact that generally speaking, groups with higher estimated initial scores showed lower rates of learning. Our preliminary speculation on this fact is that 1) this may be attributed to the "ceiling effect": it is hard for top students to make fast progress; 2) good students were assigned to Algebra class and learning content that won't be tested until 10th grade and won't appear in the ASSISTment system. Further investigation needs to be done to explain this phenomenon.
The next thing we wanted to see is if the ASSISTment system could track students' development of different skills over the course of the year. We chose a very coarse-grained model provided by the state of Massachusetts that breaks all of 8th grade math items into one of 5 strands (i.e. skills in our term) (Algebra, Measurement, Geometry, Number Sense, and Data Analysis). To deal with the fact that by breaking out student data into these 5 types we now would have fewer data points per month, we collapsed data further by integrating monthly data and obtained a new data set of quarterly data. In this new data set, each student gets 3 data waves representing their performance on particular skills in Fall, Winter and Spring of the 2004-2005 school year. In addition, we introduced the result of Sep-test as a covariate when predicting students' knowledge. We hypothesized this covariate will improve our prediction given the fact that it is well correlated with students' MCAS scores (shown in section 4.2).
Following the same approach discussed in section 5.1, we again built a series of models based on the new data set described above to track students' skill learning over time. Starting from the unconditional model, we gradually added parameters for quarter (i.e. time), skill and Sep-test result as shown in Figure 5.
We, as before, started from building model H, the unconditional means model and compared it with model I, the unconditional growth model. A difference of 191 BIC points made us conclude that model I is significantly better than model H and time again turned out to be an important factor. Also model I showed that the estimated initial PredictedScore in Oct. 2004 average over all the students is 23 points and the estimated rate of change over time is 2.4 which is statistically significant from zero (p < 0.05). A straightforward interpretation of the slope is that the PredictedScore for an average student increased by 2.4 points every quarter.
Model J evaluated the effects of Skill on initial status and rates of learning in order to answer RQ#2c: if we can track learning on individual skills. Students' differences on their initial knowledge status of the fives skills are significant. Students started as being comparably good at Algebra while bad at Measurement: The PredictedScore on skill Algebra of in Oct. 2004 was 26 points, the highest among the five skills while the score on Measurement was only 16 points. Analysis results of this model also revealed that students were learning the skill Data Analysis approximately at the same level of speed as the skill Number Sense while significantly faster than learning other skills. Given the result from model J we feel faithful to claim that we were able to track students' learning on individual skills over time.
Figure 5. Series of longitudinal models for tracking skill learning
Model K includes Sep-test scores as a predictor of both initial knowledge and change. The enormous drop-down of BIC values in model K from model I (DiffBIC = 21428) led to the conclusion that as we expected Sep-test scores is a significant predictor. This model suggests that the PredictedScore of students with higher Sep-test scores is initially significantly higher than that of students with lower Sep-test scores: one more point earned in Sep-test added 0.63 points to their initial score in the ASSISTment system, while the estimated differential in the rate of learning between students with one point difference in Sep-test scores is indistinguishable from 0 (p = 0.566). This indicates that, considered as individuals, students, who showed better performance in Sep-test didn't necessarily learn significantly faster. With regard to this fact that Sep-test has not shown to be a good predictor of rates of change, model K was simplified by eliminating the effect of Sep-test as a predictor of change and by doing this, we earned a BIC of 8 points lower in model L.
The effect of Sep-test as a predictor of only initial status and Skills as a predictor of both initial status and change were combined together in model M which turned out to have the best fitness among all models. This result accords to our hypothesis in RQ#2d and answered that question that Sep-test can help to reach a better skill-tracking model by being introduced as a covariate.
We have shown that we successfully tracked student learning of individual skills at a coarse-grained level with 5 skills involved. Next logical step is to track skill learning based on fine-grained models. The project team has incorporated the finer-grained model with 39 math standards in Massachusetts Curriculum Frameworks[9] and developed an even finer-grained model with 98 skills. With more data being collected, we will apply the same approach presented here to those models to seek for more evidence that the ASSISTment system are tracking skill learning ell.
The ASSISTment System was launched and is in its second full year of operation. It presently has 6 middle schools using the system with all of their 8th grade students. In this paper, we addressed testing challenge in this web-based e-learning and e-assessment system. We brought up five research questions concentrating on the assessment ability of the system. Some evidence was presented that the online assessment system did a better job of predicting student knowledge than normal online test system which only looks at students' performance on original items and traditional paper practice tests because items can be broken down into steps and students' response to those steps are taken into consideration in the assessment. Promising evidence was also found that the online system were able to track students' learning during a year. In the near future, the ASSISTment project team is planning to release the system statewide in Massachusetts.
Many states are moving towards adopting "value added" assessments, so that they can track the value added by teachers and schools. Value added is possibly because you have year to year state assessments so you can see the average learning gain for students per year, and attribute those gains to teachers and schools. Such systems could benefit from data that is collected every two weeks, instead of once a year, thereby allowing schools to more quickly figure out what works at increasing student learning. Because the ASSISTment system teaches [13] while it assesses, it makes the testing more politically palatable. In fact, this paper showed that because the system teaches while it assesses, its does a better job of assessing (if you hold the number of items done constant, instead of time). Are we likely to see states move from a test that happens once a year, to an assessment tracking system that offers continuous assessment ([4]) every few weeks? We don't know.
Another idea upon which we can reflect is, "what is the right way to judge a project like this one, which tries to blend assessment and assisting (increasing student learning)?" The system does not have to be either the best assessment systems in the world, or the best learning system in the world. It needs to be a good balance between the two. Fundamentally, there will always be tradeoffs between the accuracy of assessment data and increases in students' learning, due to the fact that schools have only a finite number of days in a year.
This research was made possible by the US Dept of Education, Institute of Education Science, "Effective Mathematics Education Research" program grant #R305K03140, the Office of Naval Research grant # N00014-03-1-0221, NSF CAREER award to Neil Heffernan, and the Spencer Foundation. All the opinions in this article are those of the authors, and not those of any of the funders.
[1] Baker, R.S., Corbett, A.T., Koedinger, K.R. (2004) Detecting Student Misuse of Intelligent Tutoring Systems. Proceedings of the 7th International Conference on ntelligent Tutoring Systems, 531-540.
[2] Baker, R.S., Roll, I., Corbett, A.T., Koedinger, K.R. (2005) Do Performance Goals Lead Students to Game the System? Proceedings of the International Conference on Artificial Intelligence and Education (AIED2005), 57-64.
[3] Campione, J.C., Brown, A.L., & Bryant, N.R. (1985). Individual differences in learning and memory. In R.J. Sternberg (Ed.). Human abilities: An information-processing approach, 103-126. New York: W.H. Freeman.
[4] Cyberinfrastructure for Education and Learning for the Future: a Vision and Research Agenda, final report of Cyberlearning Workshop Series workshops held Fall 2004 - Spring 2005 by the Computing Research Association (CRA) and the International Society of the Learning Sciences (ISLS).
[5] Feng, M., Heffernan, N.T.,(2005). Informing Teachers Live about Student Learning: Reporting in the ASSISTment System. Workshop on Usage Analysis in Learning Systems at 12th Annual Conference on Artificial Intelligence in Education 2005, Amsterdam.
[6] Feng, M., Heffernan, N. T., Koedinger, K.R. (2005) Looking for Source of Error in Predicting Student's Knowledge, Workshop on Educational Data Mining at AAAI 2005, Pittsburgh.
[7] Grigorenko, E.L & Sternberg, R.J. (1998). Dynamic Testing. Psychological Bulletin, 124, 75-111.
[8] Koedinger, K. R., Aleven, V., Heffernan. T., McLaren, B. & Hockenberry, M. (2004) Opening the Door to Non-Programmers: Authoring Intelligent Tutor Behavior by Demonstration. Proceedings of 7th Annual Intelligent Tutoring Systems Conference, Maceio, Brazil. page162-173
[9] Nuzzo-Jones., G. Macasek M.A., Walonoski, J., Rasmussen K. P., Heffernan, N.T., Common Tutor Object Platform, an e-Learning Software Development Strategy, to be submitted. http://www.ASSISTment.org/portal/project/papers/www/nuzzojones_etal.doc
[10] Nuzzo-Jones, G., Walonoski, J. A., Heffernan, N.T., Livak, T.(2005). The eXtensible Tutor Architecture: A New Foundation for ITS.In C.K. Looi, G. McCalla, B. Bredeweg, & J. Breuker (Eds.) Proceedings of the 12th Artificial Intelligence In Education, 902-904. Amsterdam: ISO Press
[11] Olson, Lynn. (2004). State Test Programs Mushroom as NCLB Mandate Kicks In. Education Week, Nov, 20th, 2005, pages 10-14.
[12] Raftery, A.E. (1995). Bayesian model selection in social research. Sociological Methodology, 25, 111-163.
[13] Razzaq, L., Feng, M., Nuzzo-Jones, G., Heffernan, N.T., Koedinger, K. R., Junker, B., Ritter, S., Knight, A., Aniszczyk, C., Choksey, S., Livak, T., Mercado, E., Turner, T.E., Upalekar. R, Walonoski, J.A., Macasek. M.A., Rasmussen, K.P. (2005). The ASSISTment Project: Blending Assessment and Assisting. In C.K. Looi, G. McCalla, B. Bredeweg, & J. Breuker (Eds.) Proceedings of the 12th Artificial Intelligence In Education, 555-562. Amsterdam: ISO Press.
[14] Rose C., Donmez P., Gweon G., Knight A., Junker B., Cohen W., Koedinger K., Heffernan N. (2005). utomatic and Semi-Automatic Skill Coding With a View Towards Supporting On-Line Assessment. he 12th Annual Conference on Artificial Intelligence in Education 2005, Amsterdam
[15] Singer, J. D. & Willett, J. B. (2003). Applied Longitudinal Data Analysis: Modeling Change and Occurrence. Oxford University Press, New York.
[16] Turner, T. E., Macasek, M. A., Nuzzo-Jones, G., Heffernan, N.T., (2005). The ASSISTment Builder: A Rapid Develoment Tool for ITS. In C.K. Looi, G. McCalla, B. Bredeweg, & J. Breuker (Eds.) Proceedings of the 12th Artificial Intelligence In Education, 929-931. Amsterdam: ISO Press
[1] Including nwea.org/assessments/, measuredprogress.org, Pearson and www.cddre.org/Services/4Sight.cfm
[2] The term "ASSISTment" was coined by Kenneth Koedinger and blends Assessment and Assisting.
[3] MAPS is a computer adaptive testing program from www.nwea.org
[4] As future work, once a predictive model has been built and is able to reliably detect students trying to "game the system" (e.g., just clicking on answer) students may be allowed to re-try a question if they do not seem to be "gaming". Thus, studious students may be given more flexibility.
[5] http://www.doe.mass.edu/mcas
[6] Open response questions are not supported by the ASSISTment system currently
[7] Since the ASSISTment system does not allow students to skip problems, to prevent students from being stuck, most questions in the system were built such that the last hint message almost always reveals the correct answer. This message is referred to as "Bottom-out" hint.
[8] Raftery (1995) discussed a Bayesian model selection procedure, in which the author proposed the heuristic of a BIC difference of 10 is about the same as getting a p-value of p = 0.05
[9] http://www.doe.mass.edu/frameworks/