


Next: About this document
Animating Multidimensional Scaling
to Visualize
Large N-Dimensional Data Sets
Chris L. Bentley
Computer Science Department
Worcester Polytechnic Institute
Overview
Goal: Present enhancements to Multidimensional Scaling (MDS) to extend
technique to large data sets (  points) with many dimensions (up to 50)
- What is N-dimensional data?
- How can we analyse it?
- How can we visualize it?
- Focus on one technique: Multidimensional Scaling
- Enhancements to traditional MDS: MAVIS
- Conclusions & Future Work
Visualization
- Science produces a numeric representation of our world
- We search for: patterns, clusters, anomalies, outliers, things which
make a difference to us.
- Raw numeric data is difficult to interpret
- Scientific Visualization translates numbers
 Images
 - This plays to the innate strengths of human visual perception
What is N-dimensional data?
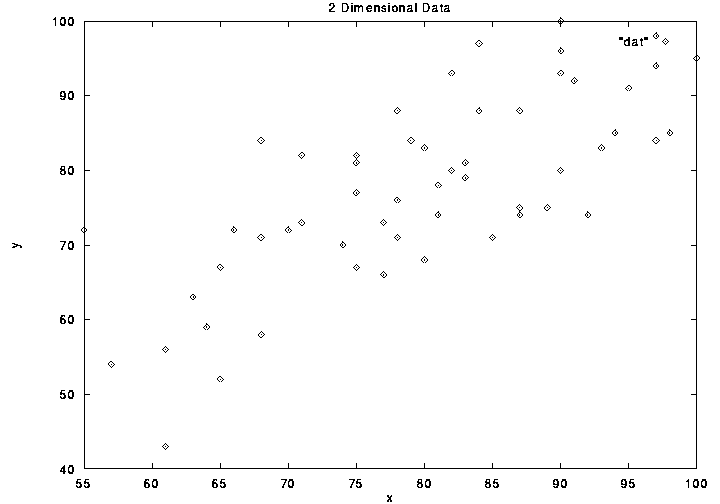
We are familiar with 2 dimensional data defined by coordinate pairs (x,y).
The Cartesian plane makes axes explicit, depicting entire data space. We can
infer coordinate values of each point from the axes
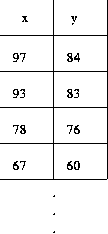
2-column table makes values explicit - leaves us to imagine data space
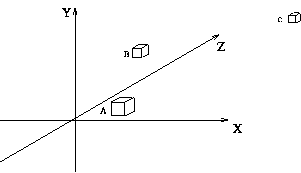
N-dimensional data consists of points in a space with N coordinate axes
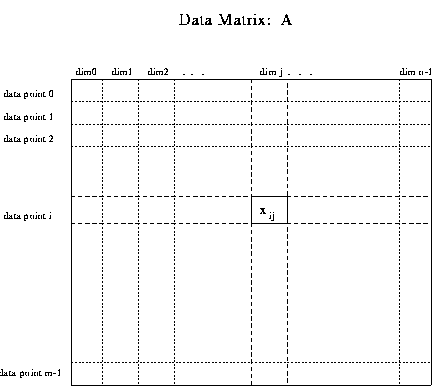
In table form, N-dimensional data is a mxn matrix. Each row i
defines a data point and is an n-vector. Each column is an axis or dimension.
Analysing N-Dimensional Data
How do we find information in an mxn matrix of numbers?
- Statistical methods - reduce data to summarizing values: mean,
variance of columns or of entire matrix, measures of correlation or
covariance between dimensions.
- Multivariate regression analysis - finds the line, plane,
hyperplane which summarizes the data with least error
- Cluster analysis - groups data points with closest n-vectors,
reduces number of data points. Cluster centroids can be treated as proxy
data points
Visualizing N-Dimensional Data
How do we picture data with  dimensions? There are four basic approaches
- look at only a subset of the dimensions (e.g. all pairs)
Multiple views can be displayed simultaneously - scatterplot matrices
- rearrange axes so that they are no longer orthogonal - star glyphs,
parallel coordinates, dimensional stacking (XmdvTool)
- provide interactive manipulation of the data, so that user can
explore data from multiple perspectives (PRIM-9)
- reduce dimensionality of the data so 2D/3D graphics techniques can
be used
Reducing Dimensionality
Goal: to reduce mxn matrix to mxp, where 
Several methods can be used:
- Factor Analysis - finds subset of columns (dimensions) which
explain majority of variance in all columns of matrix
- Principal Component Analysis - finds subset of columns
(dimensions) which explain majority of correlation in all columns of matrix
- Dimensional Clustering - combine dimensions with greatest
correlation - each iteration reduces dimensionality by 1
- Kohonen Self Organizing Feature Maps - uses neural network to
arrive at matrix of weights that summarizes all n columns
- Multidimensional Scaling (MDS) - developed between 1938 - 1962
by Richardson, Torgerson, Shepard, Kruskal. Initially used for displaying
multivariate data from psychological testing
Multidimensional Scaling: Central Idea

- measure all interpoint distances in n-dimensional data space
- place 2D display points so they obey same mutual distance
relationships
Is a perfect 2D configuration always possible? No.

Distances
- distances in any dimension are always scalar values - they are
one dimensional, thus they provide a bridge from nD to 2D
- similarity data is often analogous to distance
- 2D distance formula is familiar Pythogorean Theorem:

- generalized distance formula in n-dimensions:

- even more general Minkowski metric:

Stress
- If the nD distance
 equals the 2D distance
  then points i and j are correctly placed relative to one another
 - If
 then there is stress between the
data and the 2D representation

- For all points in data set:

- Or the variant:

Minimizing Stress
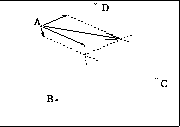
Figure shows vectors acting on point A, and cummulative vector in
which point A will be updated
Measuring MDS
- After t iterations of MDS, points will have moved into a
low stress configuration
- How good is a given MDS solution? How do we measure this?
- Shepard plot - 2D distances vs. nD distances
- Stress plot - graph of overall stress should drop
- Correlation plot - graph of correlation between 2D distances and
nD distances should approach 1.0 Calculated using Pearson's r:

- Figure 1. shows Shepard plot
- Figure 2. shows Stress graph
- Figure 3. shows Correlation graph
Problems With MDS
- Between m data points there are
 distance relationships
 - Thus stress is a function of
 variables
 - Time complexity: each iteration of MDS is quadratic. In total MDS
is between
 and
and 
- Space complexity: to store the distance matrices for
 data
points would require
  terabytes of memory (7 million megabytes)
 - As data dimensionality increases MDS has more trouble finding
a global minimum of stress.
Solution #1: Subset-MDS
How to extend MDS so that it can be used with large data sets?
- If
 distances are the problem don't use them all!
 - Use only a subset of all distances: Subset-MDS
- If each point maintains distance relations to k others
MDS will use only km distances - linear space, time complexity
- Subset-MDS sacrifices some accuracy for tractability
Questions:
- How should we select which k distances to retain?
- For given k, how well does Subset-MDS approximate MDS?
Subset-MDS: Selecting Distances
Subset-MDS could select k random distances for each point
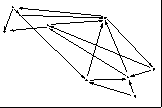
Or, Subset-MDS could retain closest k/2 & farthest k/2 distances
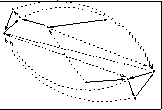
- First Figure shows starting configuration of 5-dimensional data on
iris flowers mapped to 3D. Dimensions with largest variance are used to
initialize display coordinates
- Second Figure shows Subset-MDS solution using closest
k/2 & farthest k/2 distances
- Third Figure shows Subset-MDS solution using random distance selection
Subset-MDS vs. MDS
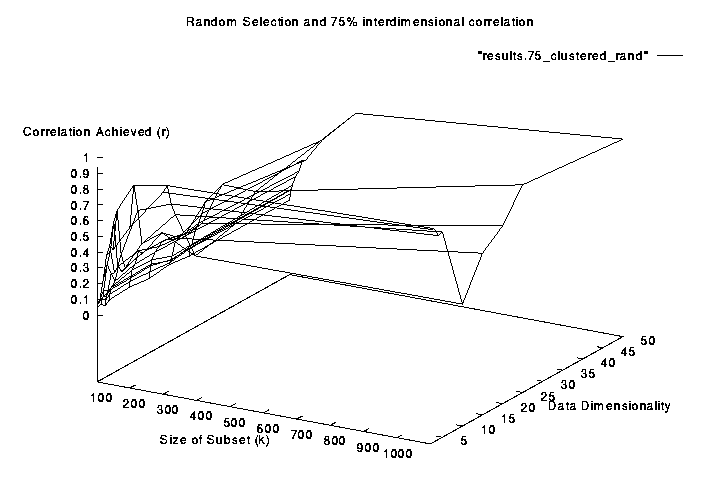
- The Figure below shows that the correlations
achieved by Subset-MDS improves as the subset size grows.
- In fact k = 10 achieves good correlations
- This is probabaly due to ``transitive relationships'' between
data points
- If A is near to B and B is near to C then
A will be placed near C for free
Solution #2: Animation + Randomness
- As data dimensionality increases MDS cannot achieve low stress solutions
- Rather than let MDS terminate in a poor local stress minimum, why not
add random noise to point positions to keep stress high?
- This will prevent MDS from equilibrating, and it will escape local
minima, or at least cycle between a set of neighboring minima
- We will get more information from this cycling than from static
- This method similar to the simulated annealing method for escaping
local minima equilibrium
- Figure shows points of 3D tetrahedron animating towards low stress
configuration in 2D display space.
- Red indicates points are highly stressed
Random Perturbation
Random noise can be added to 2D display point coordinates
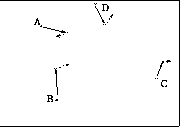
Or point updates can be scaled so points overshoot low stress position
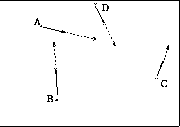
It may be necessary to interpolate between successive positions
- Figure shows points of 3D cube trapped in a high stress configuration.
- Rerunning same MDS procedure with random perturbation of display points
achieved lower stress solution
Conclusion
Summary
- MDS was briefly introduced
- Subset-MDS was proposed as linear time O(m) approximation
- Initial results indicate approximation to MDS is good
- Animating MDS with random perturbation was proposed
- More research needs to be done on this
Future Work
- Implement gradient descent MDS for comparison
- Implement simulated annealing MDS for comparison
- Research on adaptive variants of Subset-MDS
- Adding clustering to preprocess large data sets


Next: About this document
Matthew Ward
Thu Oct 10 13:28:20 EDT 1996
![]() points) with many dimensions (up to 50)
points) with many dimensions (up to 50)


![]() dimensions? There are four basic approaches
dimensions? There are four basic approaches
![]()


 then there is stress between the
data and the 2D representation


 distance relationships
 variables
 and
and 
 distances are the problem don't use them all!


