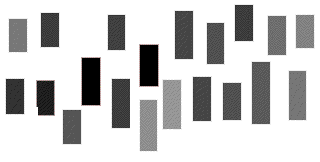
| Systolic Blood Pressure(SBP) | Hematocrit (HCT) |
| 70 | 48 |
| 70 | 44 |
| 118 | 49 |
| 50 | 35 |
| 130 | 33 |
| 142 | 51 |
| 80 | 41 |
| 86 | 34 |
| 60 | 36 |
| 150 | 49 |
| 64 | 35 |
| 60 | 49 |
| 0 | 41 |
| 80 | 37 |
| 0 | 47 |
| 60 | 34 |
| 90 | 62 |
| 110 | 39 |
| 120 | 33 |
| 30 | 34 |

When working with glyphs, the most important question to ask is, "Am I making it any easier to understand this data?
|
 |