IMGD 2905 - Data Analysis for Game Development

Homework 3

Due: Tuesday, May 2nd, 11:59pm

Total points: 23

Homework will be turned in online (canvas) in written form, saved as a PDF.


Short answer

  1. (1 point) The sampling distribution of the mean can always be approximated by the normal distribution (select all that apply).

    1. As the sample size (number of observations in each sample) gets "large enough".
    2. As the size of the population standard deviation increases.
    3. As the size of the sample standard deviation decreases.
    4. For symmetric distributions, if samples of at least 15 observations are selected.
    5. For distributions where the mean equals the median.
  2. (1 point) For samples of N=3 (i.e., there are 3 observations in the sample), the sampling distribution of the mean (i.e., the distribution of the mean values if multiple samples are taken) will be normally distributed (check all that apply):

    1. Regardless of the shape of the population.
    2. If the population is normally distributed.
    3. If the shape of the population is skewed.
    4. If the standard deviation of the mean is 3.
    5. If the standard deviation of the mean is less than 3.
  3. (1 point) If a particular set of data is normally distributed, you would find that approximately (check all that apply):

    1. 2 of every 3 observations would fall within 1 standard deviation of the mean.
    2. 19 of every 20 observations would fall within 2 standard deviations of the mean.
    3. The standard error would be smaller for 3 observations than it would be for 20 observations.
    4. The more observations you took, the lower the sample standard deviation would be.
  4. (1 point) The size (magnitude) of a confidence interval depends upon (check all that apply):

    1. The number of observations in a sample (N).
    2. The significance (alpha) / confidence selected.
    3. The mean of the population.
    4. The standard deviation of the population.
  5. (1 point) Which of the following is true (check all that apply):

    1. You can construct a finite 100% confidence interval for an estimate of the population mean.
    2. Usually, the population mean is the unknown value that is to be estimated.
    3. The significance (alpha) is the proportion in the tails of the distribution that is outside the confidence interval.
    4. The significance (alpha) is the proportion in the tails of the distribution that is inside the confidence interval.
  6. (1 point) As a WPI admissions intern, you are tasked with estimating the number of admitted students (class of '26) that will be IMGD majors. You sample 300 admitted students to WPI and find that 45 of them are planning on being IMGD majors. The 95% confidence interval for the fraction of incoming students planning on being IMGD majors is 0.15 +- 0.04. Interpret this interval.

    1. You are 95% confident that between 11% and 19% of the sampled students will be IMGD majors.
    2. You are 95% confident that 15% of the incoming students will be IMGD majors.
    3. You are 95% confident that the true percentage of incoming students that will be IMGD majors is between 11% and 19%.
    4. There is a 95% chance of selecting a sample that finds that between 11% and 19% of the incoming students will be IMGD majors.
  7. (1 point) In Hypothesis testing, the Null Hypothesis (H0) is:

    1. there is a significant difference between sample mean and population mean
    2. the sample mean is near the population mean
    3. the sample mean equals the population mean
    4. sample mean is within a standard error of the population mean
    5. none of the above
  8. (1 point) In hypothesis testing, the p value is (pick the answer that matches best):

    1. smallest level that can reject H0
    2. the area under the Normal distribution
    3. a value less than 0.05
    4. equal to the significance (alpha)
    5. the probability of the mean being at least as extreme as the one observed
  9. (1 point) In simple linear regression, the y-intercept (b) represents the:

    1. predicted value of Y
    2. change in Y per unit change in X
    3. predicted value of Y when X=0
    4. variation around the line
    5. the Y value for each X
  10. (1 point) In simple linear regression, the slope (m) represents the:

    1. change in Y per unit change in X
    2. variation around the line
    3. predicted value of Y when X=0
    4. predicted value of Y
  11. (1 point) A simple linear regression model for predicting a player's points (Y) is 6 X + 10, where X is the player's level. How many more points can a level 10 player expect to get when they level up to level 11?

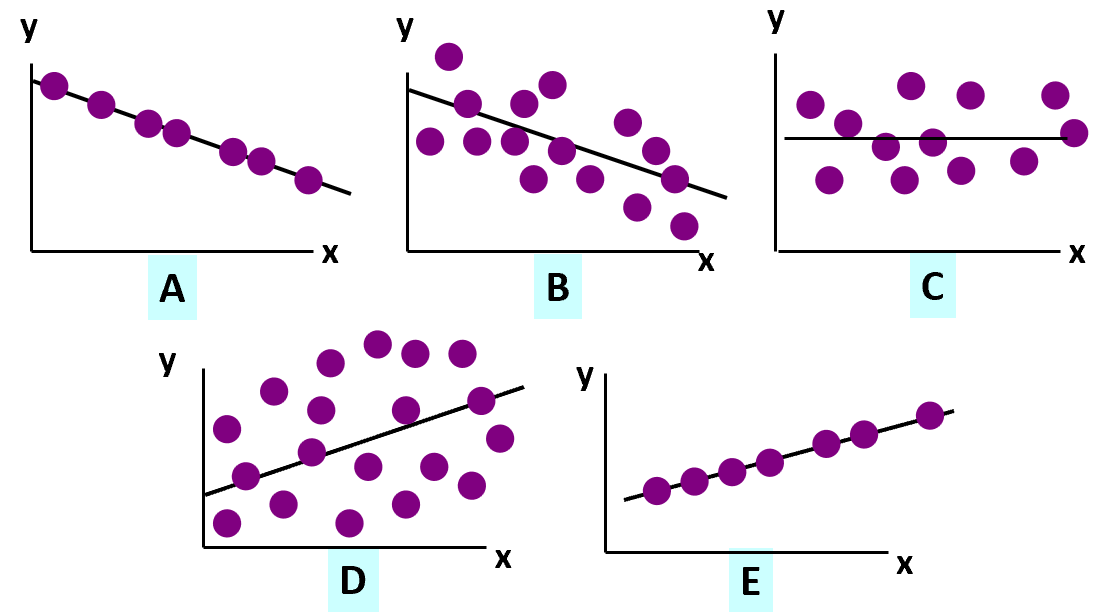
  12. (1 point) Match the scatter plots A-E that best match each of the following correlations: 0, -1, 0.3, -0.6, and 1.0.

  1. (1 point) The strength of the relationship between two numerical variables is measured by the:

    1. coefficient of determination (R^2)
    2. Y intercept
    3. total sum of squares (SST)
    4. predicted value of Y
    5. residual analysis
  2. (1 point) The residuals represent:

    1. the square root of the slope
    2. the predicted value of Y when X=0
    3. the difference between the actual Y values and the mean of Y
    4. the difference between the actual Y values and the predicted Y values
    5. none of the above
  3. (1 point) The regression sum of squares (SSR) can never be greater than the total sum of squares (SST).

    1. True
    2. False
  4. (1 point) The value of R (the correlation) is always positive.

    1. True
    2. False
  5. (1 point) The coefficient of determination (R2) is a measurement of how much variability in Y is explained by it's relationship (model) to X.

    1. True
    2. False
  6. (1 point) Considering extrapolation and interpolation as discussed in class, which answer fits best:

    1. Extrapolation is a form of prediction, Interpolation is a form of measurement.
    2. Extrapolation infers unknown values from within a sequence of measured values.
    3. Interpolation infers unknown values by extending the range of measured values.
    4. Extrapolation is more accurate than Interpolation.
    5. All of the above.
    6. None of the above.

Problems

  1. (1 point) To avoid crowded grocery stores during flu and cold season, your family is using home delivery. You pick a random sample of a typical basket of goods and compute the price that each vendor would charge for the same sample. The list is below. Compute a 95% confidence interval estimate of the mean price of a basket of goods for home delivery. Assume the underlying prices for baskets of goods across all vendors follows a normal distribution.
        $72.95 Instacart
        $85.13 Amazon Fresh
        $85.85 Fresh Direct
        $92.13 Shipt
        $72.70 Thrive Market
        $82.19 Hungry Hippo
        $72.57 Peapod
  1. (4 points) You built a racing game, Goat Runner, where players ride goats around alumni track.

    1. You sample the time around the track for 30 players and find the mean is about 15.71 seconds with a standard deviation of 4.63 seconds. Find a 90% confidence interval for the population mean time round this track.

    2. You decide the game is too easy, and add a few hurdles the goats have to jump over. A sample of another 30 players shows the mean time around the track is now 18.90 seconds with a standard deviation of of 7.1 seconds. Find a 90% confidence interval for the population mean time round this track.

    3. Draw a column chart with data from #a and #b, depicting the 90% confidence interval.

    4. Interpret the chart, including using the confidence intervals, in your comparisons of the two tracks.


Return to the IMGD 2905 home page