(1 point) Statistical inference occurs when you:
- compute descriptive statistics from a sample
- take the results of a sample and reach conclusions about a population
- present a graph of data
- take a complete census of a population
(2 points) A professor wants to study the number of hours per week that the students in her class spend playing games. She selects 20 students from the class of 100 students and gives them a survey.
All of the students in the class constitute the _________.
- sample
- population
- statistic
- parameter
The 20 students participating in the survey constitute the _______.
- sample
- population
- statistic
- parameter
(1 point) The methods of collecting, presenting and computing characteristics of a set of data in order to describe data features are called:
- descriptive statistics
- sampling
- the scientific method
- statistical inference
(2 points) Supposed an IQP wants to study the average Overwatch rank for WPI undergraduate students compared to their class year (first-year through senior year).
The observed ranks for each student is an example of
- an independent variable
- a dependent variable
- a parameter
- a sample
The observed class year for each student is an example of
- an independent variable
- a dependent variable
- a parameter
- a sample
(1 point) What is the purpose of a measure of central tendency?
(1 point) Which of the following statements about the median is not true?
- It is less affected by extreme values than the mean.
- It gets larger as the standard deviation gets larger.
- It is a measure of central tendency.
- It is equal to the mode in a bell-shaped, "normal" distribution.
(1 point) In a symmetric distribution:
- The mean equals the median.
- The mean is less than the median.
- The mean is greater than the median.
- The median is less than the mode.
(1 point) Which of the following measures of dispersion depend upon every value in the set of data?
- Standard deviation
- Range
- Both a and b
- Neither a nor b
(5 points) Consider the set of numbers: 9 1 1 10 7 11 5 8 2
What is the mean?
What is the median?
What is the mode?
What is the first quartile?
What is the range?
Consider the below histogram:
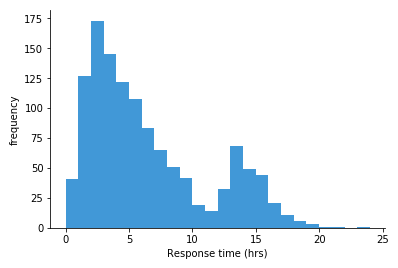
(3 points) What measure of central tendency would you use to describe it and why?
(2 points) What measure of variation would you use to describe it and why?
(1 point) Consider the below scatter plot (Figure 2) of the measured carbon dioxide (CO2) in atmosphere at the Mauna Loa Observatory on the big island of Hawaii:
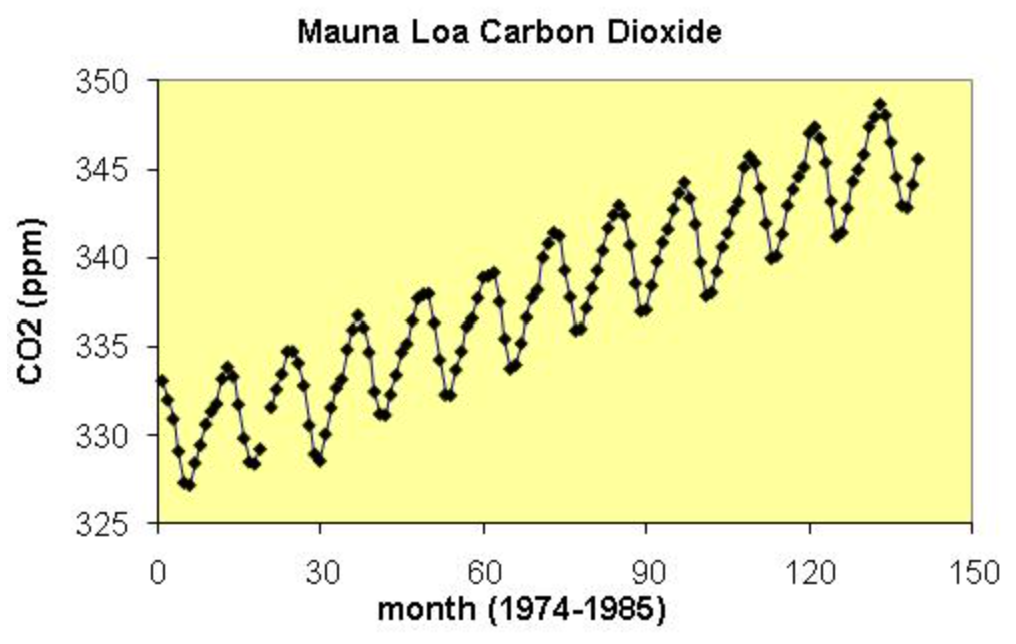
Which statement(s) best describe the relationship between carbon dioxide and time (more than one may apply)?
- From 1974-1985, the CO2 content increased.
- The CO2 content is cyclic year to year.
- The CO2 content increases every month compared to the previous month.
- The CO2 content shows an overall linear trend.
- The CO2 content shows an overall exponential.
