(8 minutes)
For each question:
You will provide your answers in the survey link below.
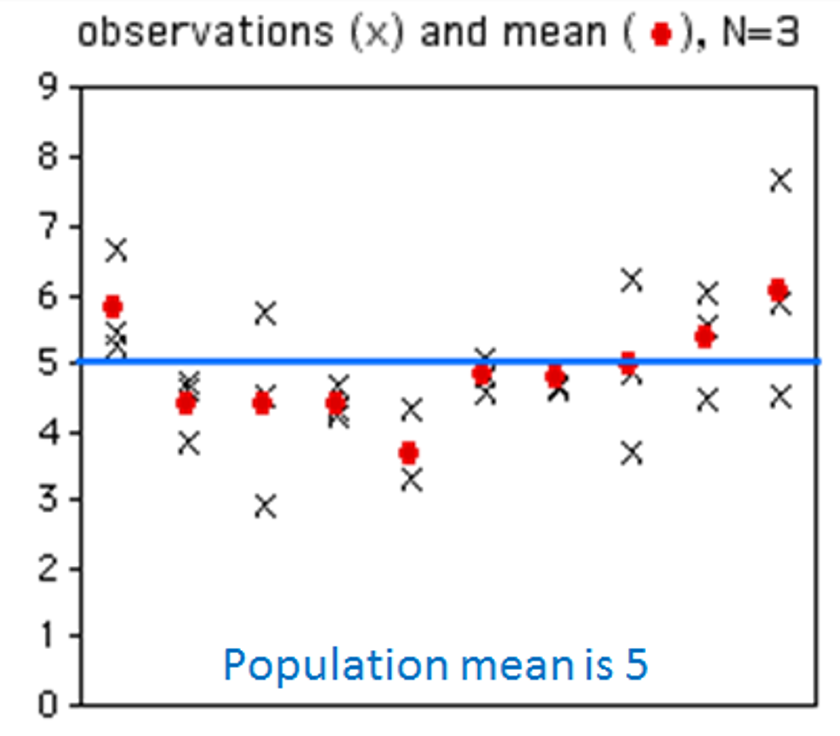
Consider the below pictures. On the x-axis is the experiment number and the y-axis is the value. The blue lines depict the population mean. Each x is a sample value.
The first graph shows 10 experiments each N=3 (i.e., sample size is 3), with the experimental mean shown with a red dot.
The second graph shows 100 experiments each N=3 with the bars depicting the standard error for that experiment.
How many of the standard error bars should intersect the blue line in the right graph?
If N=20, what would the left and right graphs look like?
If N=20, now how many of the standard error bars should intersect the blue line?
Have ONE person from each group submit the group's answers:
https://wpi.qualtrics.com/jfe/form/SV_895cSt4X7lnFchM
Make sure to include the names of all group members.
Happy standard error-ing!
-- Mark