(8 minutes)
As needed ... Introduce yourselves!
Icebreaker: What is a good non-computer game to play over Zoom?
For each question:
You will email your answers to the professor. Make sure to include all names on the email.
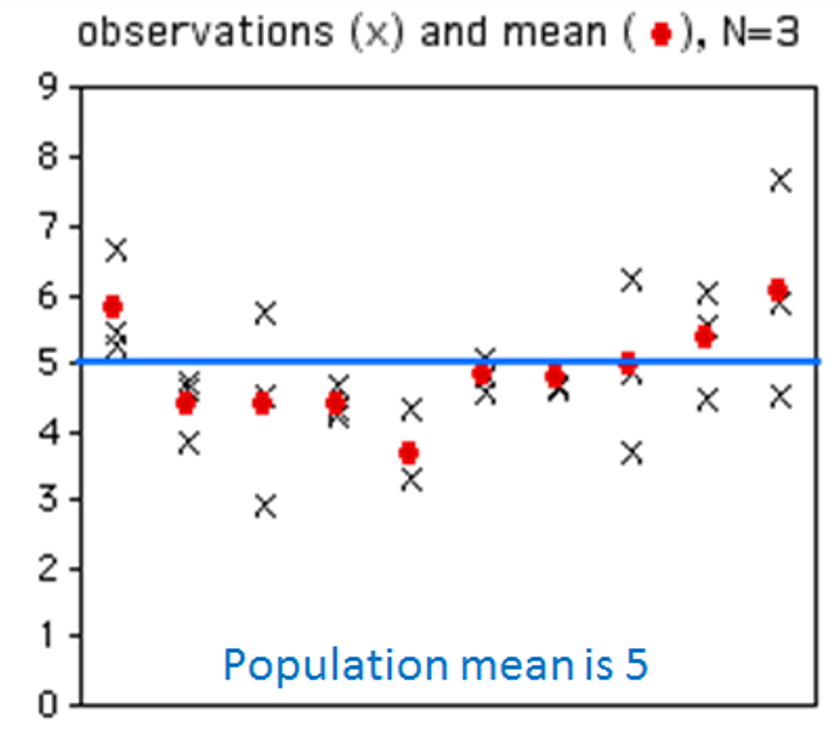
Consider the below pictures. On the x-axis is the experiment number and the y-axis is the value. The blue lines depict the population mean. Each x is a sample value.
The first shows 10 experiments each N=3, with the experimental mean shown with a red dot.
The second shows 100 experiments with the bars depicting a computation of the standard error for that experiment.
How many of the standard error bars should intersect the blue line?
What would the graphs look like if N = 20?
If N = 20, how many of the standard error bars should intersect the blue line?
Have ONE person from each group submit the group's final list.
https://wpi.qualtrics.com/jfe/form/SV_aWa9rqzH8gBE71s
Make sure to include the names of all group members.
Have fun!
-- Mark