What is the purpose of a measure of central tendency?
Which of the following statements about the median is not true?
- It is less affected by extreme values than the mean.
- It is a measure of central tendency.
- It is equal to the range.
- It is equal to the mode in a bell-shaped, "normal" distribution.
In a symmetric distribution:
- The median equals the mean
- The mean is less than the median
- The mean is greater than the median
- The median is less than the mode
Which of the following measures of dispersion depend upon every value in the set of data?
- Range
- Standard deviation
- Both a and b
- Neither a nor b
Consider the set of numbers: 9 1 1 10 7 11 5 8 2
- What is the mean?
- What is the median?
- What is the mode?
- What is the first quartile?
- What is the range?
- The data is: i) Right skewed, ii) Left skewed, iii) Symmetrical
Consider the below histogram:
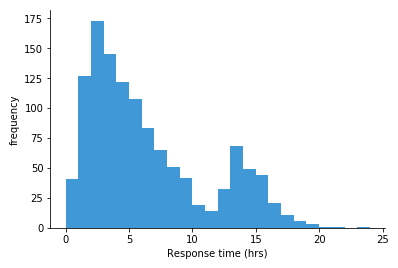
- What measure of central tendency would you use to describe it and why?
- What measure of variation would you use to describe it and why?
Consider the below scatter plot (Figure 2):
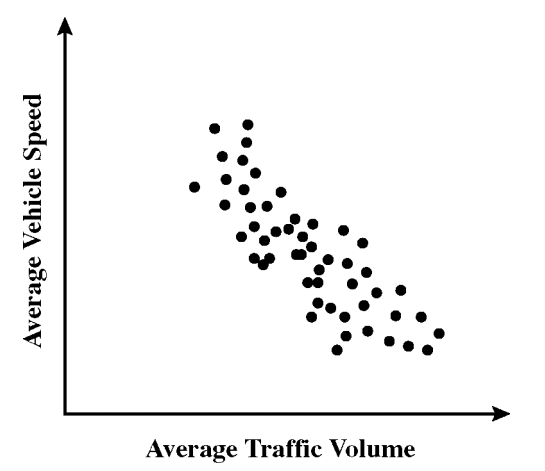
Which statement best describes the relationship between speed and traffic volume shown in the graph?
- As traffic volume increases, vehicle speed decreases.
- As traffic volume increases, vehicle speed increases.
- As traffic volume increases, vehicle speed increases at first, then decreases.
- As traffic volume increases, vehicle speed decreases at first, then increases.
