CS 110X Feb 17 2014
During the engineering exams we only need ink in our pen, nothing else is needed to answer the question paper.
Prashant Gupta
1 Second Review
This is the second in-term review of the material. Exam2 covers all material in the course up to the current lecture. I had originally considered reporting a mid-term assessment on the potential grades in this course, but now I’ve decided to do so on Thursday, after the second exams have all been graded.
Also, be sure you have the up-to-date CSV files (redownload them if need be) and review the updated HW5 description which contains some clarifications and updates.
1.1 Assessment
Let’s start with the Assessment from Friday:
Given two lists of values, return a new list which contains all values in both lists without including any duplicates.
How would you solve this problem?
1.2 Indefinite While Loop
Write a function that returns the prime factors for an integer n.
When you don’t know in advance how many times you want to iterate, then use a while loop. To factor a number, start with small prime numbers and work your way to higher ones, until you have factored the entire number.
def factor(n): primes = [] # As long as we have factors to try, keep going. factor = 2 while n > 1: # if factor, add to list and reduce n; otherwise advance if n % factor == 0: primes.append(factor) n = n / factor else: factor = factor + 1 return primes
This performs twice as many computations as it needs to, but it does work.
I chose to use the while loop construct because I don’t know how many times a factor will be present in n; however, I do know that as long as n is greater than 1, there is some undiscovered factor waiting to be found.
Note, I can’t ask this kind of question on an exam, because it requires to much preparation to write from scratch. I also eliminated it from HW5 because it is too mathematical.
1.3 Dictionary Use: Dynamically adding keys as they are discovered
In reviewing the dictionary examples so far, you have seen code that ’initializes’ the dictionary to have certain (key, value) pairs created first.
You can instead dynamically create the entry when you recognize that a given key does not exist in the dictionary.
For example, here is another way to rewrite the countBoolean function described last Thursday:
def countBooleanValues(values): """Returns a dictionary with count of True and False values""" counts = {} for key in values: if not key in counts: counts[key] = 0 counts[key] += 1 return counts
This works by first checking to see if there is an entry in counts for the given key. If not, it adds one pre-initialized to zero. The second statement in the for loop simply goes ahead and increments count associated with that key.
1.4 Dictionary Use: Compute a Histogram
A histogram is a representation of tabulated frequencies, shown as adjacent rectangles, erected over discrete intervals (bins), with an area equal to the frequency of the observations in the interval
To construct a histogram you need to define the intervals (also known as bins) and then keep running totals for each of these bins as you process data. To start, the following code shows how to compute a histogram for the number of bathrooms in house sales that appear in Sacramentorealestatetransactions.csv.
Start with the extractAllRecords function you have seen already.
import csv def extractAllRecords(fileName): """ Extract all CSV records and return as single LIST-of-RECORDS Note that the first element in this list contains the description of the columns as defined in the CSV file """ file = open (fileName, ’r’) results = [] reader = csv.reader(file) for row in reader: results.append(row) file.close() return (results)
Now add the following function:
def histogram(salesRows): """Return histogram as a list for the number of bedrooms in sales""" counts = {} # prepare dictionary with 0 counts for sales with up to 6 bedrooms for index in range(7): counts[index] = 0 for index in range(1, len(salesRows)): sale = salesRows[index] numBeds = int(sale[4]) if numBeds <= 7: counts[numBeds] += 1 hist = [] for index in range(7): hist.append(counts[index]) return (hist)
The above code creates a counts dictionary. Because you are going to need to keep a running count by number of bedrooms, the above code first prepares the dictionary by creating an entry for each total number of bedrooms.
If you were to print out counts right after the first for loop, you would see that it contains the following entries:
{0: 0, 1: 0, 2: 0, 3: 0, 4: 0, 5: 0, 6: 0}
The second for loop processes all sales from the CSV file (skipping the header row) and finds the number of bedrooms, numBeds, for each sale. As long as the number of beds is within the specified pre-determined entries, the total count for that number of beds is incremented.
Once all rows are processed, the final for loop grabs each of the histogram entries and appends to the list. Run this code as follows:
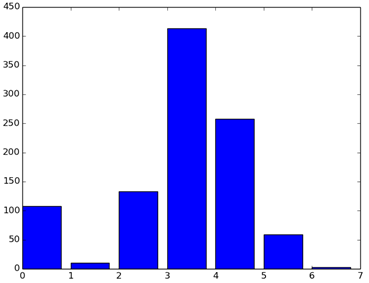
>>> hist = histogram(extractAllRecords(’Sacramentorealestatetransactions.csv’)) >>> hist [108, 10, 133, 413, 258, 59, 3]
This represents the counts in order of houses that sold with ZERO bedrooms (108) followed by houses that sold with 1 bedroom (10) and so on. It may seem odd that there are houses with ZERO bedrooms sold; inspect the data and I bet you can figure out what happened.
Another way to visualize this information is to generate a bar chart in pylab. Type the following:
>>> import pylab >>> pylab.bar(range(7), hist)
1.5 Dictionary Use: Compute a Pivot Table
Note: I considered this topic to be too advanced for homework 5, but I at least wanted you to see what was possible.
If you review the Sacramentorealestatetransactions.csv real estate transaction data, you will see there are a number of fields that seem to correlate with the overall price: beds, baths, sq__ft, price.
You may have a number of questions:
What was the average price of a 3-bedroom house?
What was the total number of 4-bedroom, 2-bath houses sold?
What was the average square footage of a 4-bedroom house, 3-bath house?
For these questions, you want to record information along two dimensions. That is, you need to store information for every possible combination of number of bedrooms and number of baths.
In Excel, you would create a Pivot Table, and it would look something like the following, which computes the average square footage of the houses sold, subdivided by number of bedrooms (columns) and number of baths (rows). The final "Grand Total" column computes the average square footage of all houses sold organized by the number of bathrooms. The final "Grand Total" row computes the average square footage of all house sold organized by the number of bedrooms.
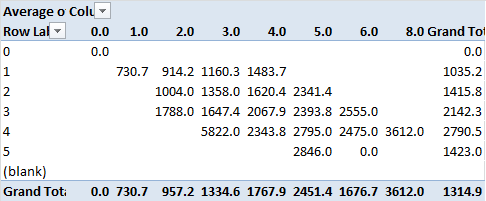
Let’s do the same in Python. You need, somehow, to keep track of square footage for each possible combination. Let’s start with what you know. You can create a dictionary that contains a number of values associated with keys. What if each of these values were itself another dictionary? That is the key observation.
In the above image, for example, assume that you created a pivot table dictionary. It would have six keys 0 through 5 (representing the respective rows of the pivot table that you see). Each of these six keys would be associated with a different dictionary whose purpose is to store the list of square footage for each of the given bedrooms.
Add the following function to your file and see what it does.
# Generate Pivot table def pivotTable(salesRows, rowIndex, columnIndex, tableIndex): """Compute and return pivot table for given values""" values = {} for index in range(1, len(salesRows)): sale = salesRows[index] rowValue = sale[rowIndex] if rowValue not in values: values[rowValue] = {} columnValue = sale[columnIndex] if columnValue not in values[rowValue]: values[rowValue][columnValue] = [] # for each (row,col) combination, append value from tableIndex values[rowValue][columnValue].append(float(sale[tableIndex])) return (values)
This returns a dictionary object that contains all information needed to generate the pivot table above. Specifically, the dictionary values which is returned maintains references to N dictionary objects, each of which represents a given row in the final pivot table. Each entry in these dictionaries contains a list of values drawn from the designated tableIndex column in the sale.
However, you still have to do some work to print this information to the screen, which is why this particular problem never made it onto the homework assignment. Write the following functions and you are done:
def pivotRows(pivotTable): """Return list of all possible row values""" rowHeaders = [] for rowValue in pivotTable: if rowValue not in rowHeaders: rowHeaders.append(rowValue) return (rowHeaders) def pivotColumns(pivotTable): """Return list of all possible column values""" columnHeaders = [] for rowValue in pivotTable: columns = pivotTable[rowValue] for columnValue in columns: if columnValue not in columnHeaders: columnHeaders.append(columnValue) return (columnHeaders) def pivotAverage(pivotTable): """Show Output Of Pivot Table for averages""" columnHeaders = pivotColumns(pivotTable) rowHeaders = pivotRows(pivotTable) columnHeaders.sort() rowHeaders.sort() for row in rowHeaders: line = str(row) + ’\t’ for col in columnHeaders: if col in pivotTable[row]: avg = numpy.average(pivotTable[row][col]) line += str(int(avg)) line += ’\t’ print (line)
To see the pivot table in action, type the following:
>>> pivotAverage(pivotTable(extractAllRecords(salesFileName), 5, 4, 6)) 0 0 1 730 914 1160 1483 2 1004 1357 1620 2341 3 1788 1647 2067 2393 2555 4 5822 2343 2795 2475 3612 5 2846 0
The above converts the average into an int to enable proper visualization.
1.6 Review Proceeds now...
In addition to the skills listed for the first exam review, the following are potentials skills I will test on Tuesday.
Python Functions
PF-2. Know how to define a function with parameters
PF-3. Know how to use return statement within a function
PF-7. Know how to document a function (""")
Control Structures
CS-6. Know how to use while as indefinite loop
CS-10. Understand nesting of for and while loops
String Manipulation
SM-6. Know how to search through a string to find delimited tokens and regions
SM-9. Know how to slice a string substring
Input Output
IO-3. Know how to write data to a file
IO-4. Know how to read in text data containing strings of text
IO-5. Know how to read in CSV formatted data
IO-6. Understand why opened files need to be closed
Data Types
DT-9. Know how to access and modify individual elements of a list
Debugging Skills
DG-4. Demonstrate logical reasoning from observed error back to failure back to code defect
1.7 Exam Format
When you come to the exam on Tuesday, you will not be able to use your laptop computer, textbook or even the clicker!.
You will be allowed, once again, to bring in a single piece of 8.5" x 11" paper on which (front and back) you have hand-written any concepts in the course. Take advantage of this opportunity. In many ways, this sheet of paper will become the best study guide you could hope for.
We have seen a number of question types so far. These are good indications of the kind of questions I ask.
Write small program – write a small program given the requirements I provide.
The Debug Question – I will show you sample code and then ask you to identify four things wrong with it (there will be likely five). You are to circle the things that are wrong, and explain what should be there instead.
Write small program – write a small program given the requirements I provide. Think of the new structures you have learned since Exam1. These include the indefinite while loop, string manipulation, and dictionaries.
Specific Python Knowledge – I may ask a question about a specific Python statement and you should be able to answer it based upon your knowledge derived from the lectures, labs and homework assignments.
1.8 Version : 2013/01/13
(c) 2014, George Heineman