See hypothesis below
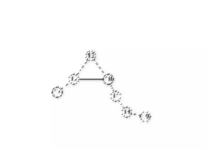
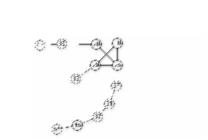
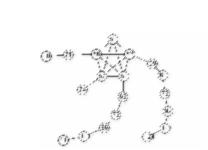
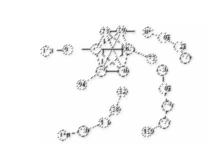
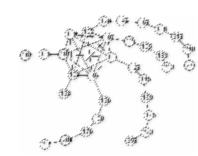
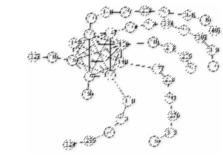
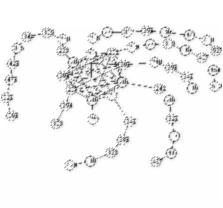
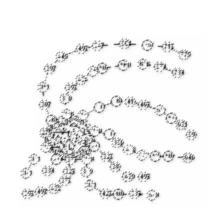
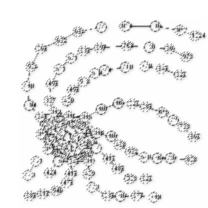
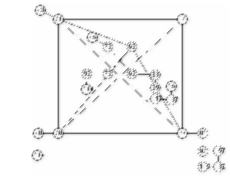
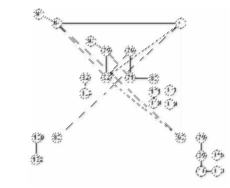
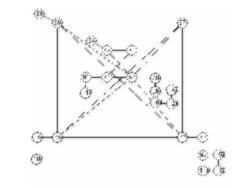
These graphs were generated using an algorithm that transforms a complete graph Kn into an SI graph.
| Graph Description | Thumbnail | Path Edges |
| 7_Vertices_7_Edges_K3.gif | |
<0,1,3> |
| 12_Vertices_14_Edges_K4.gif | |
<0,2,1,5> |
| 19_Vertices_24_Edges_K5.gif | |
<0,2,1,5,6> |
| 24_Vertices_33_Edges_K6.gif | |
<0,2,1,5,6,4> |
| 32_Vertices_46_Edges_K7.gif | |
<0,2,1,5,6,4,7> |
| 41_Vertices_61_Edges_K8.gif | |
<0,2,1,5,6,4,7,8> |
| 51_Vertices_78_Edges_K9.gif | |
<0,2,1,5,6,4,7,8,9> |
| 62_Vertices_97_Edges_K10.gif | |
<0,2,1,5,6,4,7,8,9,10> |
| 74_Vertices_118_Edges_K11.gif | |
<0,2,1,5,6,4,7,8,9,10,11> |
| Does this trend continue? | See hypothesis below |
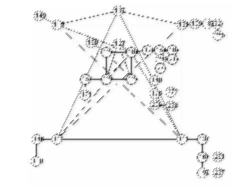
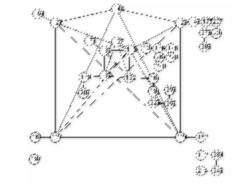
For k >= 7, construct a graph G around a complete graph Kk such that (in counter clockwise fashion), linear arms are constructed outwards from each node in Kk to be of length <0,2,1,5,6,4> for the first six nodes while the remaining (k-6) nodes have paths of length 7+i for i = 1 to k-6.
| Graph Description | Thumbnail |
| 26_Vertices_34_Edges_K4_K5.gif | 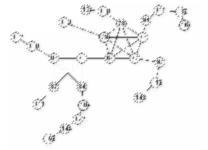 |
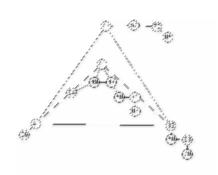
| CrazyAdditions_K4.gif |  |
Nothing
Is there a maximum degree for a status injective graph? For example, there can't be two nodes with degree n-1 since they would both, then, have the same status value (n-1). While there is no clear answer to this question, here are some graphs that show empirical results.
| Name | MaxDegree | NumVertices | Added subgraphs | Ratio | sqrt(2n-1) | sqrt(n) |
| Phase0 | 3 | 7 | ||||
| Phase1 | 4 | 12 | <3,0> | 3 | 4.795832 | 3.464102 |
| Phase2 | 6 | 16 | <2,0> | 2.666667 | 5.567764 | 4 |
| Phase3 | 8 | 30 | <12,0> | 3.75 | 7.681146 | 5.477226 |
| Phase4 | 10 | 47 | <15,0> | 4.7 | 9.643651 | 6.855655 |
| Phase5 | 12 | 59 | <10,0> | 4.916667 | 10.81665 | 7.681146 |
| Phase6 | 14 | 78 | <17,0> | 5.571429 | 12.4499 | 8.831761 |
| Phase7 | 16 | 91 | <11,0> | 5.6875 | 13.45362 | 9.539392 |
| Phase8 | 18 | 101 | <8,0> | 5.611111 | 14.17745 | 10.04988 |
The upper bound must be higher than sqrt(2n-1). Without any theory to go on -- simply the results from the graphs in phase 2 and beyond that increase the max degree by 2 -- the max degree may be best expressed as: dmax = (7*n+189)/51. These odd numbers come from the trendline when calculated within excel that gives R value of .9956 for the equation 51/7*dmax - 27 = n.
See stats.xls for details.
Another approach seeks to add complete graphs around a central target node, thus creating a high degree node within an SIJ. The following table shows the results.
| max deg | n | |E| | Long Path | Ratio | |
| Phase1 | 3 | 7 | 7 | 3 | 2.333333 |
| Phase2 | 6 | 20 | 23 | 9 | 3.333333 |
| Phase3 | 10 | 37 | 46 | 10 | 3.7 |
| Phase4 | 15 | 60 | 79 | 12 | 4 |
| Phase5 | 21 | 96 | 130 | 20 | 4.571429 |
See stats.xls for details. Results (for converging trend lines) are similar to Try 1 below.
Again, similar to Try 2.
| max deg. | n | |E| | Longest Spine | sum stat | ratio: n/max | ratio: n/|E| | |
| Phase1 | 1 | 2 | 1 | -- not SI -- | |||
| Phase2 | 3 | 5 | 5 | 1 | -- not SI -- | ||
| Phase3 | 6 | 11 | 14 | 2 | 250 | 1.83333333 | 0.785714 |
| Phase4 | 10 | 21 | 30 | 3 | 1220 | 2.1 | 0.7 |
| Phase5 | 15 | 38 | 57 | 6 | 5468 | 2.53333333 | 0.666667 |
| Phase6 | 21 | 62 | 96 | 8 | 18152 | 2.95238095 | 0.645833 |
| Phase7 | 28 | 103 | 158 | 19 | 78992 | 3.67857143 | 0.651899 |
The upper bound has a quadratic formula to show its max value. In short form, one can see that dmax is no greater than 3.36 * sqrt(n).
See stats.xls for details.