
|

CS 563 Advanced Topics in Computer Graphics: Rendering Plants
Cliff Lindsay - Spring, 2003 WPI
1. Introduction
The rendering of plants in an ecosystem involves three separate tasks that result in a visually complex scene. This paper will describe these rendering tasks according through a level of detail approach - with each level possessing greater detail. For example, the first level of detail consists of rendering the ecosystem scene. The second level involves a more detailed rendering of the structure of plants. The last level of detail focuses on the interaction between leafs and light.
Because of a recent paradigm shift in Computer Graphics toward rendering images as they naturally exist, the material presented in this paper will adhere to this shift and focus on techniques that are more physically based. The models that included teaser approximations where excluded in lieu of models that more accurately reflected the natural order of plants. However, even with this approach, there is still a significant amount of approximation that is required due to the lack of information, the complexity of the models, and/or resource limitations.
2. Prerequisite: L-Systems
L-Systems are a fundamental tool when developing models for rendering plants. An L-system is a String rewriting mechanism that reflects biological motivation. L-systems can be described as a language that can be implemented to depict how plants in an ecosystem react to certain stimuli over periods of time. L-systems are used to describe plant growth, mortality, plant interaction with plants and the environment. Essentially, anything that is desired in the ecosystem can be written into a rule for the L-system.
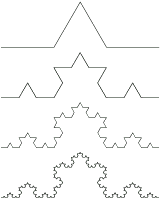
Figure 1. Four Generations of a Koch Curve Using L-systems.
L-systems are composed of three basic parts: an alphabet, axiom, and productions. The strings in an alphabet for a L-system are designed according to the environment that is to be described. For example, the alphabet to describe a plant leaf may simply consist of a line (F), a positive turn angle (+), and a negative turn angle (-); {F, +, -}. . An axiom is the starting string for a simulation. For example, if the simulation began with the symbol F, that would indicate 1 unit of forward movement. The alphabet and axiom need rules in order to produce more complicated models, these rules are called productions. . Productions are general rules that are governed by biological motivation of plants
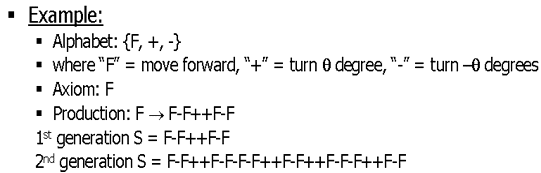
Figure 2. Example L-System used to generate the first Generation of the Koch Curve(Figure 1)[Przem90].
Productions are the rules that govern a simulation's outcome. Barring a few restrictions, productions allow for virtually any type of rules. A simple production might be F ® F-F++F-F, which translates to: replace every F with a move forward, a negative turn angle, a move forward, 2 positive turn angles, another move forward, a negative turn angle, and finally a move forward. After several interactions of productions, known as derivations or generations, the remaining string is used in the simulation to produce the entity.
3. Plant Distributions in Ecosystems
When designing a virtual ecosystem there are several factors that need to be taken into account to make the ecosystem look natural. These factors are the terrain, plant positioning, self-thinning, and multiple species of plants. Terrain specification is a necessary first step to realizing the type of environment in which plants are to be placed. The terrain data will influence many aspects of plant life and will play a large role in the distribution of plants throughout your ecosystem. Proper plant distribution is a subtle but important feature of rendering a natural ecosystem. Small changes in the placement of plants can widely affect the natural look and feel of an ecosystem; therefore attention must be made to ensure that plants are not distributed randomly but with some natural measure of placement. This can be accomplished through clustering and clumping models as well as competitive models (inter and intra species).
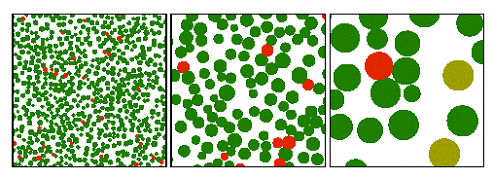
Figure 3. An unclustered view of 3 different generations of a plant ecosystem simulation[deussen98].
Terrain generation literally lays the foundation for you're the ecosystem, and it's the features of this terrain that will drive the how the scene should naturally look. For instance, if you generate marshland, which is saturated with water most of the year plants that thrive in that type of environment will do well where as plants that don't will not. Although the terrain guides the development of the plants in its ecosystem, the terrain is relatively static and the plants themselves are reacting to their environment. This environmental reaction can be described with an L-system with production rules that account for a plant's reaction to its environment.
Plants in nature are rarely evenly distributed throughout an ecosystem but instead cluster or clump (figure 4) in locations that are favorable to the growth of the plant. Also, plants tend to shed their seeds in close proximity to themselves resulting in groups of plants in a single area. We can simulate these plant distributions by initially placing plants randomly then following up with a procedure to move their locations to coincide with a more natural placement. Some of these features include statistical measures for clustering, such as the Hopkins Index, which is used as an attraction index for the plants. If the Hopkins index is greater than one, plants are attracted and congregate in communities, but an index of less than one tends results in repelling and more uniform plant distributions.
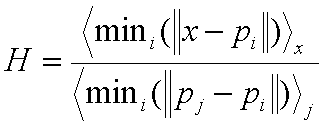 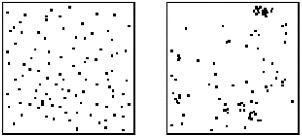
Figure 4. Left, Hopkins Index used to cluster plants, right a view of unclustered, H=.4(left) and clustered H=2.4(right) [Brendan02].
Once the plants are initially distributed, generations of plant life can be created using the L-system that describes plant lifecycles. This process can be done until one is satisfied with the look of the scene, usually several generations of plant life cycles. However this L-system earlier is a simplified version of what is necessary to actually model groups of plants, therefore, several additions to the underlying structure of an L-system are necessary. For example, multiple Axioms or starting strings are a necessary addition if multiple plants will be rendered at one time. Also, communication features need to be added in order for the environment to interact with the plants when changes in the terrain's condition such as seasonal changes, weather, and other events that affect the terrain. Other elements that need to be added are fragmentation of the plant (cutting and replanting of a limb), Dynamic addition and removal of plant, and productions that act on multiple plants simultaneously are necessary for natural looking scenes. An L-system that incorporates these added features was developed by Brandon Lane and Przemyslaw Prusinkiewicz called the Multiset L-system [Prusin02].
After your customized Multiset L-system is developed, plants are then ready to grow in the simulated ecosystem. When doing so, you may notice subtle irregularities that are not accounted for in the previous descriptions such as unnaturally uniform distributions of plants. One way to remedy this problem is to use a Hopkins Index for clumping or cluster of you virtual scene. The Hopkins index only accounts for interspecies positioning and will not account for clustering based on symbiotic relationships, interspecies competition, or shading tolerance. As a result, production rules need to be developed for the Multiset L-system to account for these and any other factors that may arise in your simulation. Therefore, L-systems can be very useful because it is a flexible language that helps describe the factors for plant life with its only limitations being the level of complexity of production rules that were generated.
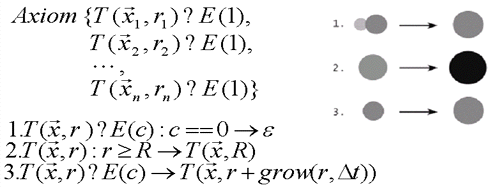
Figure 5. A L-System demostrating simple plant life cycle with productions on N plants. 1 corresponds to a communication from the envionment that kills the plnat(possibly domination). 2. Is the saturation of the radius of the plant. 3 is a growth production. Right is a pictorial respresentation of the L-system productions.[Brendan02].
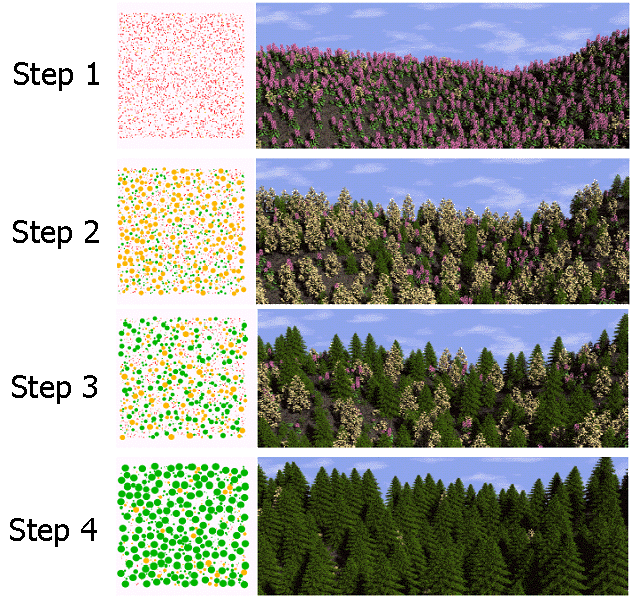
Figure 6. Result of rendering an ecosystem after several generations[Brendan02].
4. Plant Structures
Describing plant structures consists of a working set of primitive structures and parameterize these primitives to form the plants. Jason Weber and Joseph Penn [weber95] developed a model that depicts how plants are structured. This model accounts for two primitives: stems that are used for all branching structure in a plant (including trunk), and the leaf. The most powerful aspect of the model is the parameterization of the primitives, which is extremely flexible and accounts for a wide variety of plant structures.

Figure 7. Example of primitives and a object space coordinate system[weber95].
One or more stems forming the trunk of the plant can be used as the base of the structure with stems branching from this base. Each successive branching forms levels where the trunk would be level 0, a major branch level 1 and splitting from there would add additional levels, and leaves would be the final level. Weber claims that most plants can be formed using three to four levels at the most, with leaves being the last level. Stems will form their own coordinate systems so that angle parameters will be with respect to the stem as opposed to the whole tree. This technique of using object space rotations is standard in Computer Graphics and should not be unfamiliar to the reader.
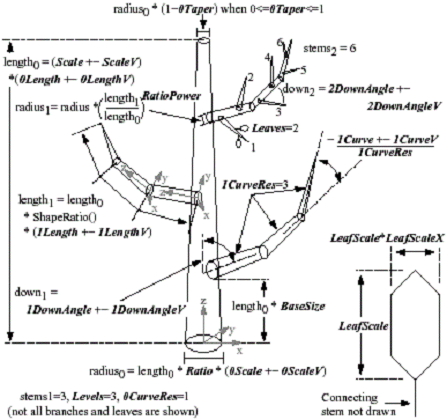
Figure 8. Example of multilevel sets of primitives and all the paramters[weber95].
The strength of this model stems, not from the relatively few primitives, but from the parameterization of the primitives. The model's parameterization can account for almost every possible size, shape, color, curve, number of splits, split angle, taper, and orientation of each primitive. Such parameterization is mostly based on direct physical observations and tree references manual. Therefore, one only needs to obtain such a reference and plugin the values from the reference to reproduce the desired tree.
Parameters for leaves exist as well, assuming the plant requires leaves. The term leaves is referred to in a generic sense and is actually the final node to be rendered in the tree structure (usually occurring at level 3 or 4). Leaf parameters take in account leaf shape, density on stems, and angle orientation with respect to the stem. Other parameters exist that directly affect the tree as whole and help to produce naturally occurring features of the plant. These parameters are terms that envelop the whole tree, such as pruning, which specifies the maximum shape or curvature the plant will exhibit. Other examples are vertical attraction toward the sky or toward the ground.
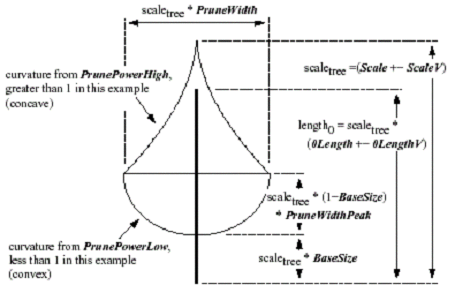
Figure 9. This is an image of some of the special parameters that can be employed like pruning, vertical attraction, etc.[weber95].
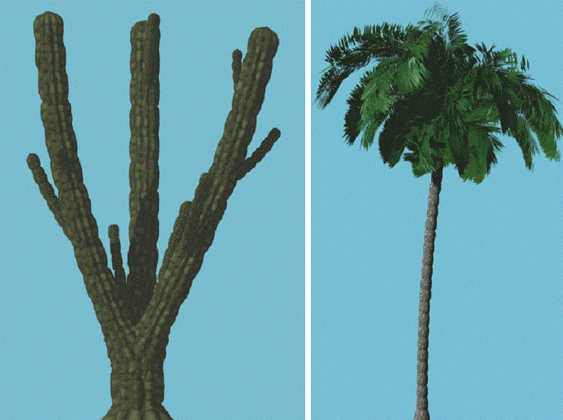
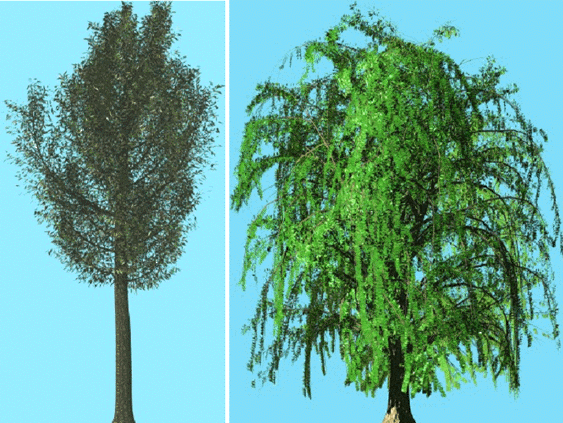
Figure 10. Result of rendering several primitives with various parametes from tree reference manuals[weber95].
5. Light Interaction With Plant Structures
There are several methods for describing light interaction with leaves and other leaf-like elements. Each method possess its own techniques for calculating reflection, subsurface scattering, and transmission of light, but they all share a common need to describe the underlying cell structure of the plants. Algorithmic bidirectional surface scattering distribution function Model, or ABM is a model that can describe these interactions. Bidirectional surface scattering combines the effects of bidirectional reflection distribution function (BRDF) and the bidirectional transmission distribution function (BTDF), which are used to describe reflection and transmission characteristics of materials [baran97].
Plant leaves are constructed by connecting cells together to produce tissues, and in assembling tissues together to represent the blade of the plant. Typical cells are defined as a concentric object filled by three different media: cell wall material (cellulose+ hemicellulose + lignin), chlorophyll, and water, in order of appearance. Because they do not contain chloroplasts, only two media define epidermal cells. Each medium is homogeneous (i.e., the physical and biochemical properties at each point are equal) and isotropic. The epidermal layer is characterized by its thickness, its refractive index n, and its absorption coefficient k [goverts96].
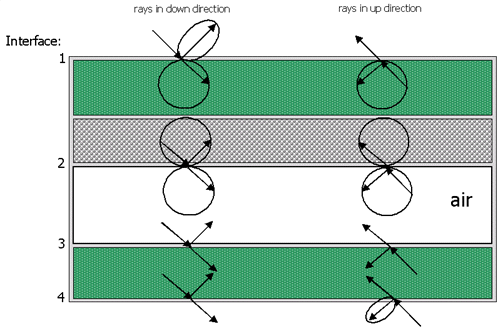
Figure 11. Ray paths for a leaf with epidermal, mesophyll, and air. This picture shows the reflectance and transmittance. Recreated from[bara97].
Govaerts et al. has shown that the epidermal cells can be approximated by oblate ellipsoids. An oblate ellipsoid has semi-axes a1, a2 and a3, and a1 = a2 but a3 < a1. For the plant cells, a1 and a2 are considered the axes in the plane of the foliar tissues, with values corresponding to average radius, ar, of the cell. Unlike the oblateness definition used by Govaerts et al., ABM defines the oblateness of the cell as ar/a3. The epidermal cells' dimensions regarding several species of plants have been described in the literature [baran97].
To simulate the effects of the epidermal cells' shape on the reflected rays at the air to epidermal cells interface, the light rays are perturbed using a warping function. The perturbation is performed through angular displacements, ae and be. The angle ae corresponds to the polar angle with respect to the ideal reflection or ideal transmission direction. The angle be corresponds to the azimutal angle around the ideal reflection or ideal transmission direction. Therefore, leaves whose epidermal cells' oblateness is large will have a surface reflectance closer to a specular distribution than leaves whose epidermal cells' oblateness is small [baran97].
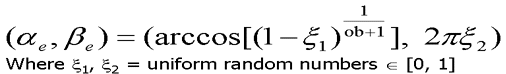
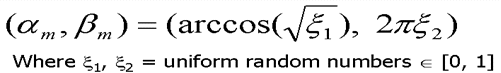
Figure 12. Angle displacement needed due to diffuse looking reflection. Top equattion is surface displacement(epidermal), bottom subsurface displacement(mesophyll)[bara97,98].
Rays entering the leaf's tissue have a certain probability of being absorbed by the leaf cell structure. This probability can be determined by the path length of the ray as described by Beer's law. A test is performed at the moment the ray enters the material. If the path length P is greater than the thickness of the material, the ray escapes, otherwise it is absorbed. This test takes in account a global absorption coefficient, thickness of the plate, concentration of material, and ray angle.
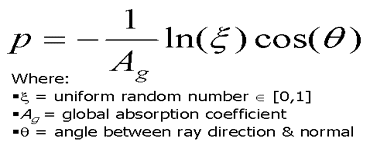
Figure 13. Path length determination used for Beer's law of absorption. This is used to determine if a ray is absorbed by the leaf cells[bara97,98].
6. Conclusions and Future Direction
In conclusion, several effective techniques have been developed to render plants as they would naturally appear in their ecosystem. This paper described a 3-tiered level approach based on level of detail to render an ecosystem as realistic-looking as possible. These approaches can be effective tools for rendering most types of plant life excluding pine needles. Due to the physical nature of pine needles, rendering light interaction with them is not well predicted by the models presented in this paper.
While a considerable amount of work has been conducted on rendering realistic-looking plants in their natural environment, future research is necessary to generate models that will approximate scenes undistinguishable from reality to the observer. More specifically, there is still a need for the capture and conversion of many BRDF data for various types of plant leaves. In addition, greater acquisition by the Computer Graphics field of the biological knowledge of the complexity of the inner working of leaves is necessary to build more accurate models.
Additional Information
References:
- Jason Weber, Joeseph Penn,"Creation and Rendering of Realstic Trees", Proceedings of the 22nd annual conference on Computer graphics and interactive techniques September 1995.
- G. V.G. Baranoski, J. G. Rokne Simplified model For Light Interaction with Plant Tissue,Proceedings of the Eighth International Conference on Computer
- G. V. G. Baranoski, J. G. Rokne. An algorithmic reflectance and transmittance model for plant tissue, Computer Graphics Forum (EUROGRAPHICS Proceedings), 16(3):141-150, September 1997.
- Przemyslaw Prusinkiewicz, Aristad Lindenmayer,The Algorithmic Beauty of Plants, Springer Verlag, 1990
- Oliver Deussen, Pat Hanrahan, Bernd Lintermann, Radomir Mech, Matt Pharr, and Przemyslaw Prusinkiewicz, Realistic modeling and rendering of plant ecosystems, Proceedings of SIGGRAPH 98
- Brendan Lane, Przemyslaw Prusinkiewicz, "Generating spatial distributions for multilevel models of plant communities, Proceedings of Graphics Interface 2002.
|