DRAFT Version:
Wed Jun 6 17:48:37 EDT 2001
An Evaluation of the Effects of
Web Page Color and Layout Adaptations
D. C. Brown, E. Burbano, J. Minski & I. F. Cruz.
Computer Science Dept.,
WPI, Worcester, MA 01609, USA.
Email:
dcb@cs.wpi.edu,
ifc@cs.wpi.edu
1. Introduction
An Adaptive Web Site molds itself to the user, creating a unique
interaction [Brusilovsky, 1998]. The intention is to provide a more
personalized and enjoyable experience, but also to increase the
success of an interaction. Success can be measured in a variety
different ways, depending on the site and its use. These include the
speed of the completion of the task, and related measures, such as the
number of mouse clicks.
This research studied the effect of web page adaptations on
information finding tasks at a web site [Burbano & Minski, 2001].
Many components in the user interface can be altered to produce
adaptations, such as page content and web links, but we have limited
our work exclusively to the alteration of color and layout.
The hypothesis studied in our research was that these adaptations
would allow users to complete tasks in a shorter time, and that this
effect would occur whether the adaptations were used individually or
together.
While Adaptive Web Sites are normally dynamic, in order to focus on
the `effects' of adaptations we used predetermined adaptations,
creating a set of "static" web sites containing all the adaptations to
be studied.
A web-based experiment was designed that required each subject to
answer three questions. The answer for each could be found by
searching through a web site. A local copy of a portion of IBM's
Sydney 2000 web site was used for these experiments, in which one
hundred and twenty eight students participated.
Each question was associated with a different adaptation of the web
site. For each question, each subject saw either no adaptation (N), a
color adaptation (C), a layout adaptation (L), or a combination of
both color and layout adaptations (B). In order to reduce the
potential effects of learning, and to compensate for adaptation order,
the experiment was kept brief and a balanced experimental design was
used.
The `Color' adaptations, the `Layout' adaptations, and the combined
adaptations all reduced task completion time. It was concluded that
there was significant support from the experimental data for the
hypothesis.
2. Literature Review
2.1 The Impact of Color & Layout
There is a subtle and complex relationship between color
usage and effectiveness. However, researchers agree on some major
guidelines. For example: use color sparingly; use color consistent
with cultural and standard meanings; use colors that contrast well;
and avoid saturated colors [Shneiderman, 1998] [Najjar, 1990] [Doore
et al, 1993] [Krebs & Wolf, 1979].
Color affect symbol legibility, and user performance for all colors
improves with larger symbols [Durret, 1987]. It is an effective
coding method for reducing visual search time on complex displays, and
its advantage increases as the amount of symbol density
increases. However, if the target's color is unknown, performance is
inferior to searching without color [Durret, 1987].
Search time for color-coded displays increases as the number of
displayed items of the target's color increases, and also with the
number of differently colored items. Even though the use of color
aids a user's task for most situations, adding color that does not
convey any meaning yields a longer search time [Krebs & Wolf, 1979].
Layout affects the efficiency of visual access. Guidelines, such as
complying with the left-to-right, top-down reading direction, are
often used. These include: following standard layout conventions;
matching common eye scanning directions; using left or right justified
fields and labels appropriately; good use of whitespace; using
sufficiently large icons, buttons and other "targets"; and designing
layouts to reduce cursor movements [Mullet & Sano, 1995] [Shneiderman,
1998].
2.2 Evaluation of User Interfaces
Evaluation can be done using a variety of methods. Expert reviews
methods include Heuristic evaluation, Guidelines review, Consistency
inspection, Cognitive walkthrough and Formal usability inspection
[Shneiderman, 1998].
Usability testing, and laboratories, are focused on identification of
user needs and relating the interface to its users. Surveys are a
very convenient method of evaluation, and are a familiar, inexpensive,
and generally an acceptable companion for usability tests and expert
reviews.
Evaluation with a large number of participants provides a sense of
authority to the results, compared to the possibly biased and variable
results of the small number of usability-test participants, or even of
expert reviewers. Web-based experiments allow large samples that
differ demographically from the usual, available subjects [Birnbaum,
2000] [APS 2001].
2.3 Evaluation of Adaptive Hypermedia
Adaptive hypermedia systems are developed, and therefore evaluated,
with five key factors in mind: what application areas are suitable;
what user features inform the adaptation. (e.g., goal, interests,
experience); what can be adapted (e.g., color, links, layout); what
adaptation mechanism to use; and what is the goal of the adaptation
(e.g., reduce errors, increase speed) [Brusilovsky, 1998].
Our work has focussed on evaluating the interaction between what
can be adapted and the goal of the adaptation, with little or no
attention paid to the other factors.
Every evaluation tends to include the following essential steps:
Identifying the purposes or objectives of the evaluation; Experimental
design, including selecting suitable methods, subjects, tasks,
measurements, and analysis frameworks; Running the experiments, and
collecting the relevant data; Analyzing the data; Evaluating the
results and drawing conclusions. [Browne, 1990, pp. 163-164]
Usually, evaluating adaptive systems is not the same as evaluating
regular interfaces, because of the nature of adaptive processes.
Comparative evaluation is typically done against a non-adaptive,
static system. In our case we have used static systems that represent
the results of the possible adaptations, their combinations, as well
as no adaptations.
***some notes here about evaluation of adaptation from the literature***
e.g., Hothi & Hall, Kobsa, Specht, Ardissono
3. System Design & Implementation
3.1 Interface Design
To be able to accurately measure performance improvements in our
subjects, we needed to reduce stress on the user. Dealing with a new
Website, and all that entails, is a significant source of stress. It
is usual for much time to be lost while the user is getting to know
a Website.
However, when an interface uses common content and well-known
subject-subject relationships, used consistently, users tend to
anticipate what the site will offer, and concentrate on taking part in
the experiment. This suggested using a site developed for a large
audience, with well-known subject matter.
Given this requirement, we then decided on the contents to be
displayed. The 2000 Sydney Olympics Website appealed to us for
several reasons:
- this site was developed by the IBM e-business team, an
experienced group of developers;
- the site used easy-to-understand language, to accommodate the
large readership;
- its content was non-technical;
- the site was structured in a similar fashion to the way we
envisioned the material for our controlled experiment, as a wide tree
of nodes.
The interface for the experiment presents the user with a set of tasks
to be completed. The interface design has two frames, an upper one
containing a question that defines the current task, and a set of
possible answers, while below, in the second frame, the subject can
traverse a local copy of the Olympics site to locate the answer.
Despite admonitions not to use frames [Nielson, 1996], we decided to
use them so that users would not have to toggle between two active
browser windows.
3.2 Aspects of the Software Design
The software for the experiment was required to collect the number of
clicks, the elapsed time, and the answers to each of the tasks for
every user in the experiment. Data needed to be written to a file
when each user had completed their tasks. Also, every task question
needed to be read from a file located on the server side. Cookies
were used as temporary storage during each interaction with a user.
Perl [2000] was chosen as the implementation language as it could
handle operations with files quickly and reliably, including opening,
closing, reading and writing on the server side. It could also be
used to handle cookies, to generate HTML dynamically, and to get
information from forms.
A final, important feature that Perl has is that whenever a
request comes to the server for a specific script, the server creates
a separate process. This means that unforeseen interactions between
subjects using the web pages can be avoided.
4. Design of the Experiment
4.1 The Adaptations
Color change was chosen as one of our adaptations, as it is easy to
implement, and important for conveying information such as order,
magnitude, etc. In this experiment use of color was limited to the
enhancement of grouping and order relationships.
Page layout change was chosen as the second adaptation. While not as
easily implemented, their potential for great impact makes them
important to study. Layout can easily make specific information more
accessible to the user. It can emphasize importance and order when
dealing with large amounts of information (e.g., data positioning in a
list).
These two adaptations have the advantage that they can be used by
themselves or can easily be combined.
For the experiment, it was important to keep in mind the order in
which the results of the combinations are achieved. For example,
knowing that layout adaptation A combined with color adaptation B
yields a positive result does not mean that combining the adaptations
in the opposite order will yield the same result.
A sample web page with both Layout and Color Adaptations is shown in
Figure 1. In contrast to the page in the "None" category, on this
page the countries are sorted alphabetically (layout) and are color
coded to match the continents on the map (color).
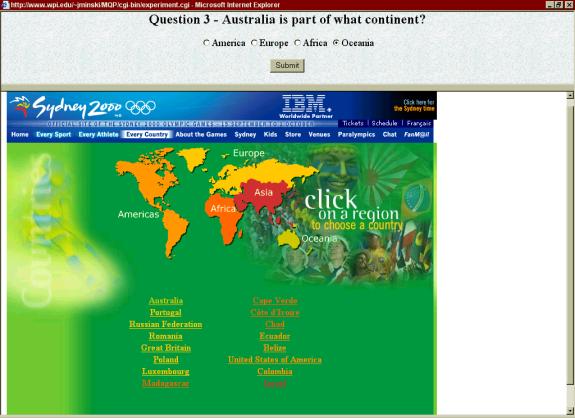
Figure 1: A sample web page with both Layout and Color Adaptations.
4.2 Catering to the Subjects
For any statistical analysis to be significant one must account for
variation by testing a substantial number of subjects. Our
Internet-based approach allowed subjects to visit our experiment from
anywhere and at anytime. This helped to increase the sample size.
Other benefits were that accurate records and measurements could be
recorded online, and that it relieved us from having to reserve time
and space in which to conduct the experiments.
During our experiment we wanted to keep the subjects as comfortable as
possible, and also to try to reduce the effects of learning.
We achieved this goal by limiting their interaction with the system by
reducing the number of experiment phases, only presenting them with
three tasks, each defined by a question about the Olympics.
We were able to keep the completion time for each subject to about 9
minutes.
4.3 The Stages of the Experiment
The presentation of the experimental itself was divided into four
parts. First, an Experiment Briefing presented overall details
that subjects needed to know before starting the experiment. This
included what the site is about, and what Internet browser was
preferred.
Next the subject saw the Tutorial. This included a sample screen
capture from an actual experiment with important interface elements
labeled, particularly the two frames. This familiarity with the
experiment's interface should help speed up initial use.
Next the users filled out a Demographics form. Here, information such
as: age, major, username, citizenship, Internet experience and Olympic
knowledge was recorded.
Users then entered the "Experiment" section. As each question was
presented to the subject, he/she has to `surf' the Olympics site
presented in the lower frame, and find the answer. Every link-click
made by the subject was recorded, as was the time from
"question-prompt" to "question-finish". Measurements were independent
of whether they correctly answered the question.
Recordings were made for each question. Once the user had
successfully finished their last task, they were thanked for their time
and informed that their information had been saved. Saving the
statistical information at that point, prevented recording any
incomplete data for a user.
4.4 The Web Site
Because the 2000 Sydney Olympics Web site that we used had to be
modified -- to reduce its complexity and ensure control over its
organization -- we aimed at achieving a broad, shallow tree.
Schneiderman [1998] encourages designers to limit trees to three
levels in depth: "when depth goes to four or five, there is a good
chance of users becoming lost or disoriented." He mentions that
better productivity (speed, accuracy, preference) occurs when users
encounter at most eight nodes (in its leaf level) in a two level deep
tree.
In order to reduce user learning, tasks were selected such that the
answer to each question they saw was located on a considerably
separated leaf node in the Web site structure. In addition, tasks had
to be challenging for the users and require them to actually browse in
order to answer correctly. It was also very important to select tasks
such that finding the answers could be enhanced by color, by layout or
by both adaptations.
A sample question, used for Layout adaptation and for Color
adaptation, was:
In the men's marathon what was Kenya's position in relationship to
that of Ethiopia?
The answer choices given were:
Same; Better; In between; Worse;
with "In between" being the correct answer.
4.5 The Form of the Experiment
We designed a "diamond graph" (Figure 2) where each of the four nodes
were adaptations. In this diagram, C is for `color' adaptation, L is
for `layout' adaptation, N is for `no' adaptation, and B stands for
`both' adaptations,
Figure 2: Experiment Design.
Each subject was exposed to one of the 4 paths between N and B. The
paths are: BCN, BLN, NCB, NLB. Subjects were randomly assigned,
dynamically at the time of browser use, into one of the four groups
that corresponded to these four paths. This "counterbalancing"
approach provides compensation for the potential effects of
presentation order. In addition it keeps each subject's experiment
short.
5. Results
One hundred and twenty eight subjects participated in the experiment.
From the Demographics forms completed we know that: all of the
subjects were aged 18 to 23 years old; 73% of the subjects were
Computer Science students; 58% were intermediate Internet users, 38%
experts, and 3% beginners; and 57% had beginning Olympics knowledge,
30% intermediate, and 9% expert knowledge. Similarly to Internet
experience, more knowledgeable users in this field might have had an
advantage, allowing faster task completion.
As two of the paths through the experiment included color adaptation
and two included layout adaptation, it was necessary to analyze the
data in two separate batches. One analysis was conducted for subjects
who worked with the set of adaptations: Both, Color, and None.
Another analysis was done for: Both, Layout, and None. A one-way
repeated measures analysis of variance was conducted for time and for
number of clicks, for both groups.
Results were significant at p < .0005 levels, which means that the
probability of achieving these results by chance alone was less than 5
in 10,000. These results indicate that there are significant
differences between the effects of each adaptation.
First, we analyzed the overall effects of the two Both-Color-None
groups (BCN and NCB) and how each adaptation affected users'
performance with respect to time (Figure 3).
Figure 3: Overall time average for B, C, and N.
The adaptation was graphed as a function of its mean time value. In
this case, 64 subjects account for the data. Clearly, the Both
adaptation has reduced task completion time to slightly less than half
that of None, and is a significant reduction compared to Color
alone. The p-level in this analysis was less than .0000001, making
these results strongly significant.
Analysis of the Both-Layout-None group (BLN and NLB) also shows how
each adaptation affected users' performance with respect to time
(Figure 4).
Figure 4: Overall time average for B, L, and N.
Sixty four subjects' data was used in this case where the Both
adaptation correlated with a speedier task completion, being slightly
twice as fast as Layout, and nearly three times faster than None. The
p-level here was less than 0.000006, again greatly significant.
After the two groups were analyzed for time, we analyzed the
behavior of the users in terms of number of clicks, with similar,
significant results. The strongest adaptation continued to be Both,
yielding half as many clicks compared to Color, and nearly one third
of the clicks in the None case.
We also included "planned comparisons analysis" between individual
adaptations for both groups. This identifies significant differences
between individual adaptations. For the Both-Color-None group, Both
was faster than Color with a significance of 0.00038. It was faster
than None with a p-level of zero. For the Both-Layout-None group,
Both was faster than Layout with a p-level of 0.0017, while being
better than None with a p-level of 0.00011.
The experiments were set up in such a way that no single user was
exposed to both Color and Layout adaptation alone. It would have been
inaccurate to compare these adaptations since the data used did not
correspond to the same context or users. However, it can be seen in
the graphs that the Color adaptation generated faster task completion
than Layout. However, this might have been caused by the complexity
of the tasks or the degree of adaptation used.
6. Conclusion
It was concluded that there is significant support from the
experimental data for the hypothesis that adaptations allow users to
complete tasks in a shorter time, and that this effect occurs whether
the adaptations are used individually or together.
Users achieved their task goals faster when adaptations were present.
Color or layout adaptations by themselves reduced average times and
number of clicks compared to when there was no adaptation. Even
faster task completion occurred when color and layout adaptations were
combined.
The study suggests that changes in color or layout tend to be more
effective when the previous task was completed with no adaptation. In
addition, color adaptation produced more effect than layout
adaptation. However, the color and layout adaptations were used in
totally different contexts. We also have no way of knowing whether
these adaptations represent the same degree of change.
Future studies should categorize both layout and color adaptations,
and more systematically vary them in an experimental situation,
correlating the results with the type of task, and with user
preferences and characteristics. In addition, these categories of
adaptations should be matched with techniques for accomplishing the
adaptations dynamically.
References
APS (2001) Psychological Research on the Net,
http://psych.hanover.edu/APS/exponnet.html, American Psychological
Society.
Liliana Ardissono
M. H. Birnbaum (Ed.) (2000) Psychological Experiments on the Internet.
Academic Press.
Browne, D., Totterdell, P. & Norman, M. (1990). Adaptive User
Interfaces. London: Academic Press.
Brusilovsky, P. (1998). Methods and Techniques of Adaptive
Hypermedia. In: Adaptive Hypertext and Hypermedia,
(Eds.) P. Brusilovsky, A. Kobsa & J. Vassileva,
Kluwer Academic Publishers, pp. 1-43.
de Bra
E. Burbano & J. Minski (April 2001) Qualitative Analysis of Web Site
Color and Layout Adaptations, Major Qualifying Project, MQP-DCB-0004,
Advisors: D. C. Brown & I. F. Cruz,
http://www.cs.wpi.edu/~dcb/MQPs/MinskiBurbano/, Computer Science
Department, WPI.
G. S. Doore et al (1993) Guidelines for using color to depict
meteorological information. Bull. Amer. Meteor. Soc., Vol. 74, No. 9,
pp. 1709-1713. Available as: http://www.cdc.noaa.gov/iips/color.html
Durrett, H.J. (1987). Color and the Computer. Orlando, FL: Academic
Press, Inc.
J. Hothi & W. Hall
Alfred Kobsa
M. J. Krebs & J. D. Wolf (1979) Design principles for the use of color
in displays. Proc. Society for Information Display, Vol. 20,
pp. 10-15.
Mullet, K. & Sano, D. (1995). Designing Visual Interfaces: Communication
Oriented Techniques. Mountain View, CA: SunSoft Press.
Najjar, L. J. (1990). Using color effectively (or peacocks can't
fly). IBM TR52.0018, Atlanta, GA: IBM Corporation.
Available as: http://mime1.gtri.gatech.edu/mime/papers/colorTR.html
Nielsen, J. (May 1996) Top Ten Mistakes in Web Design.
Alertbox, http://www.useit.com/alertbox/9605.html
Perkowitz, M. & Etzioni, O. (April 1997) Adaptive Sites: Automatically
Learning from User Access Patterns. Proc. 6th Int. World Wide Web
Conf., http://www.scope.gmd.de/info/www6/posters/722/
Perkowitz, M. (1999). Towards Adaptive Web Sites: Conceptual Framework
and Case Study. Proc. 8th Int. World Wide Web Conf.,
http://www8.org/w8-papers/2b-customizing/towards/towards.html
Perl (2000) The Perl Reference Guide, O'Reilly & Associates,
http://www.squirrel.nl/people/jvromans/perlref.html
Shneiderman, B. (1998). Strategies for Effective Human-Computer
Interaction. Addison Wesley Longman, Inc.
Markus Specht
http://www.cs.wpi.edu/~dcb/MQPs/MinskiBurbano/paper.html
|