Project
Number: DCB-0004
ANALYSIS
OF WEB SITE COLOR AND LAYOUT ADAPTATIONS
A Major Qualifying
Project
Submitted to the
Faculty of
WORCESTER POLYTECHNIC
INSTITUTE
In partial
fulfillment of the requirements for the
Degree of Bachelor of
Science
By
__________________
Esteban Burbano
__________________
Joel Minski
- Adaptive
Web Sites
- Color
- Layout
Approved:
___________________________
Professor David
C. Brown
___________________________
Professor Isabel F. Cruz
Computer Science
April 25, 2001
This project studies how color and
layout adaptations in a Web site can yield a more successful task completion
for users. Our goal was achieved by
experimenting with select users, allowing them to complete certain prescribed
tasks in a Web site, while measuring the time and the number of clicks it took
them to achieve their objectives.
Experimentation and analysis shows that both single and
combined adaptations to Web sites yield a more successful task completion.
The World Wide Web
has evolved so rapidly that users have become acquainted with the idea of
asking for the development of complex systems: systems that aid use and exploit
the user’s capabilities. Users know they have the power to demand more because
developers continue to provide innovative means that increase their
productivity and enhance their interaction with the Web.
One of these means
is the creation of a system that molds itself to the user, creating a unique
interaction; experts call this an Adaptive Web Site [Nielsen, 1999].
This method not only custom-fits each interface, making it a more personalized
and enjoyable experience, but it aims to increase the success of an
interaction. Success can be measured in different ways including the speed of
the completion of the task, and related measures, such as the number of mouse
clicks. Many components in the user interface can be altered dynamically but we
have limited our system exclusively to color and layout.
In order to
perform our studies we decided to create a static
Adaptive Web Site. There are considerations concerning not only who is going to
use the system, but also what is going to be included in the interface. Studying the effects of color and layout
adaptations is very important when determining the best way of displaying them.
The relationship between content, and user’s knowledge about the topic, can
correlate to a more successful interaction.
This project
consisted of an experiment that displayed the same information using different
adaptations in color and layout in a measurable way. During the experiment the
adaptations were presented in different order for different users. This method
helped us analyze and develop combinations of color and layout that yielded a
speedier task completion, and also reducing number of clicks for the completion
of the task. “Time” was measured as the time it took a user to complete a given
task, and “clicks” as the number of link clicks that the user made before
completing the task.
The system was developed
following a methodology that allowed us to define every component of its
structure. We were following steps, which, complemented by our Literature
Review, aimed for a very good system design. Determining the task, the content
(that is going to be adapted), user-relevant information, system adaptation,
system design and implementation (interface, and experiment), gathering the
results of the experiment and analyzing these results, were all stages that we
completed in order to prove our hypothesis. This hypothesis states that in a
Web site with color and layout adaptations, tasks can be completed with a
reduction in time and number of clicks.
We will now
describe this report in its entirety. After having completed the steps of the
methodology described above we came to certain conclusions about the effects of
color and layout adaptations on the success of a user’s navigation. As part of
our methodology, the design phase defined the requirements and the
specifications of the system that we were building. We not only describe the
interface that displayed the Web site and the adaptations that were made, but
also the experiment (one that measured users interaction with the Web pages
while completing given tasks) and the program that gathered the information concerning
the experiments. In these sections of the report we describe all the
considerations made when implementing the experiment and everything that was
related to it: including the interface and the information-gathering program.
After describing
the design of the entire system, there is a section about the implementation
details and another section that describes how the system performed its data
gathering procedures. This data was examined to determine how effective the
adaptations were, which adaptations were more successful than others and why.
The results
section of this report starts by showing how the experiment was conducted, on
which dates, and who the subjects were.
After this brief introduction we display all the results in the form of
tables and graphs, explaining what each of the results appeared to show before
analyzing them in detail.
Analyzing the data
was a very important part of this project, since that lead to the final
conclusion about the effectiveness of color and layout adaptations in Web
sites. The following time-click
analyses were computed: each of the color and layout adaptations, the
combination of both, and all of these in conjunction with the non-adapted
versions.
In the following
pages of this proposal we will explain in more detail the methodology, design,
implementation, results and analysis that were conducted in this project.
Developing a system that
adapts layout and color by using users’ goals, interests, preferences,
knowledge, cultural background and experience requires a lot of knowledge about
many different topics. In this section
we will include reviews of books, papers, and Web pages that contain
information relevant to our project, regarding user interfaces, adaptive Web
sites, means for adaptation, adapting color, adapting layout, and user models.
Unlike other technologies
such as computer hardware, where its development has been steady, there has not
been year-to-year progress in user interface design. The development of user interfaces can be characterized as having
long periods of stability interrupted by rapid change [Van Dam, 1995].
Depending on the hardware
that was available at each time, we can identity four different generations of
user interface design, each one different from the other in style. The first period (1950s and 1960s) consisted
mainly of computers used in batch mode, where punched cards were used as input
and line printers as output; there were essentially no user interfaces since there
were no interactive users.
The second period in the
evolution of interfaces (early 1960s through early 1980s) was the era of
timesharing on mainframes and minicomputers using mechanical or “glass”
teletypes (alphanumeric displays), when for the first time users could interact
with the computer by typing in commands with associated parameters.
Text-based commands
remained in the user interface world during the 1970s, but at Xerox PARC they
started the third age of user interfaces.
This new age consisted of faster graphics-based networked workstations
and “point-and-click” WIMP GUIs (Graphical User Interfaces based on Windows,
Icons, Menus, and Pointing devices); a type of interface that we still use
today. WIMP GUIs were later used by
Macintosh (1984), by Windows on the PC and by Motif on Unix workstations. Applications today still make use of WIMP
interfaces, and it seems that they are sufficiently good for conventional
desktop tasks [Van Dam, 1995].
In his paper titled Post-Wimp
User Interfaces: The Human Connection, Andries Van Dam [1995] argues that
the newer forms of computing and computing devices available today need the
appearance of a new fourth generation of user interfaces. He calls them “post-WIMP” user interfaces. This new form of user interface does not use
menus or forms, but relies on gesture and speech recognition for operand and
operation specification. The
development of this new type of interface started in the early 1990s and
continues until the present day.
With just a few exceptions,
GUI applications currently do not express much from a communication standpoint.
But now, with the arrival of new GUI technology, higher degrees of freedom in
the use of color, fonts and images, has given people without the necessary
background the capacity of creating “realistic” and expressive printed
materials [Mullet, 1995].
The growth of the use of
graphical interfaces is leading to the creation of products based on visual
programming, program visualization, and graphical data display. They have been
used in a wide variety of scheduling tools, project management systems,
personal information managers, visual programming environments, and the
Internet, more specifically the World Wide Web. Web Pages serve as graphical interfaces for the information that
the developer is trying to communicate. This is done in order for it to be
simpler to retrieve and understand the information contained in the World Wide
Web [Mullet, 1995].
User Interface
designers can get absorbed so much by their creations that they may fail to
test them. Some of the more experienced
users have come to the conclusion that extensive testing is a necessity when
creating a graphical interface. As
described by Ben Shneiderman in his book titled Designing the User Interface
[1998]: “If feedback is the ‘breakfast of champions’, then testing is the
‘dinner of the gods’ ”. However, in order to develop a good testing phase, we
must choose from many possibilities.
The method chosen to test the quality of an interface depends on the
following determinants:
·
Stage of Design (early, middle, late);
·
Novelty of project (well defined versus explanatory);
·
Number of expected users;
·
Criticality of the interface (for example,
life-critical medical system versus museum-exhibit support);
·
Costs of product and finances allocated for testing;
·
Time available;
·
Experience of the design and evaluation team.
[Shneiderman 1998, pp. 124-125]
Among
the types of testing that can be conducted are Expert Reviews, Usability Testing,
Surveys, and Acceptance Tests. Although
informal testing done by colleagues can provide useful information, more formal
tests by experts have proved to be more effective. If the staff and/or consultants are available, expert reviews can
be conducted on short notice and rapidly.
This kind of review can occur either early or late in the design process
and the results displayed as a formal report.
There are a wide variety of expert reviews methods, such as Heuristic
evaluation, Guidelines review, Consistency inspection, Cognitive walkthrough
and Formal usability inspection [Shneiderman, 1998].
Usability
testing and laboratories is focused more on the users’ needs. When designers started implementing this
type of testing, they thought it was time consuming and that it did not achieve
its goal. However, as experience grew and the success of projects was credited
to the testing process, usability testing, and usability laboratories, became
more popular, especially for identification of user needs and relating the
interface to its users [Shneiderman, 1998].
Surveys
are a very convenient way of implementing a testing phase because they are a
familiar, inexpensive, and generally an acceptable companion for usability
tests and expert reviews. The large number
of participants that a survey may include gives it a sense of authority
compared to the possibly biased and variable results of the small number of
usability-test participants or expert reviews.
The keys to successful surveys are clear goals in advance and then
development of focused items that help to attain those goals [Shneiderman,
1998].
Acceptance
tests are used for large implementation projects. The customer or managers
usually set objective and measurable goals for hardware and software performance. More specifically, as the requirements of
the software or hardware are set, if the system fails to satisfy these
requirements then it must be implemented again or corrected until success is
demonstrated.
In the last five years, the
popularity of hypermedia systems as a tool for user-driven access to
information has increased. Adaptive
hypermedia is a new area within user-adaptive systems research. Experts are
trying to implement these systems as new tools for user-driven access to
information. The goal of this new area
is to increase the functionality of hypermedia by making it personalized. In
these adaptive systems, a model of the user’s preferences, knowledge, goals and
other user information is developed. It is used throughout the interaction
between the user and the system for adaptation to the needs of the user
[Brusilovsky, 1995].
Acknowledging that
end-users are heterogeneous was the first step towards the creation of adaptive
systems: systems that rely on user models to present information in an
interface that is suitable for each individual with different preferences,
interests, knowledge, cultural background, and goals, etcetera.
Adaptive systems
have been created to aid the users in their navigation and yield a faster and
more enjoyable task completion.
Adaptive interfaces assist the user in his/her navigational process by
predicting the path that he/she is trying to follow, by recognizing the plan
that the user has, and by not making the user do actions that can be avoided or
can be performed by the system [Browne, 1990].
One could say that
the objective of building adaptive systems is to improve human-computer
interaction. However, adaptive systems
serve many other purposes. There are a wide variety of purposes that may
characterize what adaptive systems are build for.
One objective is
to extend a system’s lifespan, in which the system is designed and implemented
in such a manner as to achieve longevity in the marketplace by continuous
adaptation. This is similar to the
concept used by software engineers, “designed for maintainability”, which
recognizes that changes will occur in a system’s environment.
Another purpose is
to widen the system’s user base. This is very important since the market for
computer systems is growing very quickly and with this growth there is an
increase in diversity of computer technology users.
Enabling users to
achieve their goals is also why adaptive systems are developed. Users make use
of computers to help them achieve their goals, but it could be the case that
non-adaptive systems do not allow users to achieve their goal in the way that
they wish.
Adaptive systems
satisfy user needs. It is very
important for end-users to be satisfied with the tools and systems they are
expected to use, and adaptive systems offer them this quality. In some circumstances the primary objective
of adapting an already existing system will be to improve its operational
accuracy and speed.
Adaptation can
also assist the user in a navigational sense; by knowing enough user
information, the system can assist the users in their navigation by providing
less browsing space, suggesting relevant links to follow, by commenting on
links, or by displaying information in such a way that the user can relate to
it easily [Brusilovsky, 1995].
Reducing
operational learning is also very important because when the user first uses
the system there is a period in which he/she needs to learn how to use the
system and how to achieve his/her goal using the tools that the system
offers. Adaptive hypermedia tries to
overcome this problem using the information it gathers about the user, by
adapting the information and links presented in the site to a given user. Finally adaptive systems enhance user
understanding of both the system and the information displayed by the system
[Browne, 1990].
Adaptive
hypermedia systems can be used for any application that could be used by people
having different goals, knowledge, preferences, and interests, and where the
hyperspace is large. Users with all
these differences may be interested in following different paths through the
navigation and may be interested in different pieces of information from a
site.
In order to implement
adaptive hypermedia systems a set of methods and techniques must be defined
before starting the process of the development of the system. Adaptation
techniques refer to methods of providing adaptation in existing hypermedia
systems. Each method is based on a clear adaptation idea, which can be
presented at a conceptual level. In order to develop adaptive hypermedia
systems it is first necessary to establish the basis for classification of
methods and techniques. These dimensions are very similar to those used in
adaptive systems in general.
·
The first dimension is where adaptive hypermedia
systems can be helpful. This
dimension is to identify the application areas in which the system can be used
and for each of these points, the goals that can be partly solved by applying
adaptive hypermedia techniques.
·
The second dimension is what features of the user
are used as a source of the adaptation. This dimension identifies the most
important user features for the adaptation and discusses the common ways to
represent them (e.g., goal, interests, knowledge, experience).
·
The third dimension is what can be adapted by a
particular technique. These features of the system can be different for
different users.
·
The fourth dimension is how to adapt. There are
several ways to adapt hypermedia such as direct guidance, multimedia
presentation and text presentation (e.g., color, layout, content).
·
The fifth dimension of classification is the adaptation
goals achieved by different methods and techniques. This dimension consists
of why these methods and techniques are applied and which problems of the user
they can solve (e.g., reduce errors, increase speed to reach a goal). The adaptation goals are dependent on the
application area.
[Brusilovsky,
1995, pp. 3-4]
In order to progress in the
design and validation of adaptive computer systems a means to evaluate the
performance of this type of system is needed.
In addition to methods that measure the total performance of the system–its
ability to adapt and to affect behavioral measures–testing is also necessary to
support the design process. Sometimes self-testing mechanisms are incorporated
into the system so that it can self-regulate its performance [Browne, 1990].
Evaluation of interfaces
often occurs after the interface has been built. But evaluation of a system at an earlier stage in the development
can highlight basic flaws in the design, which might not otherwise become
evident until a later stage. Modifications to the system at a later stage would
probably be much more complicated and time consuming [Browne, 1990].
Evaluations can be divided
into two different types; “formative evaluation”, which is evaluation during
the development of a system, and “summative evaluation” which is evaluation of
the final system. As adaptive system
developers have used it, formative evaluation involves monitoring the system
during the development stages and trying to identify any modifications or
improvements that can be made in the future system development. Summative evaluation involves an estimation
of the overall performance of the system in terms of impact, usability and
effectiveness of the system [Browne, 1990].
Formative Evaluation uses open-ended
techniques such as interviews, questionnaires, attitude survey and
multidimensional scaling while summative evaluation focuses more on
quantitative techniques, those that can measure the system’s impact and
effectiveness such as response time and error rate. However, both quantitative and qualitative techniques may be
appropriate at a certain stage of the development process [Browne, 1990].
Another way of evaluating adaptive
systems is by applying comparative and/or diagnostic evaluations. Comparative evaluation is applied by
comparing the effectiveness of a system against another system, whilst
diagnostic evaluation compares the performance of the system with certain
criteria of usability. Evaluating
adaptive systems comparatively has often been criticized since the two systems
that are being compared often offer new ways of doing things, therefore it is
hard to compare two systems that are not identical in functionality and do not
offer exactly the same tools [Browne, 1990].
Another distinction between
different methods for evaluating adaptive systems is between explicit and
implicit evaluation. The designer of the interface usually conducts implicit
evaluation; i.e., he or she applies concepts known about design techniques in
order to measure the effectiveness of the system. Explicit evaluation, on the
other hand, involves identifying evaluation objectives and then developing
experiments that achieve those objectives [Browne, 1990].
In order to produce an effective
evaluation of an adaptive system, the testing has to be done following certain
steps. There are many versions of what the steps of the evaluation process
should be. In fact, everyone conducting
an adaptive system evaluation can come up with his or her own evaluation
process. However, the following are the essential steps for evaluation:
·
Identifying the purposes or objectives of the
evaluation. This includes identifying: the commissioner of the study, the
audience and, most importantly, the criteria or reason for the study.
·
Experimental design. This includes prior
identification of suitable methods, subjects, tasks, measurements, experimental
setting, and resources.
·
Collecting the results. This involves running
the experiments and collecting the relevant data.
·
Analyzing data. This involves using suitable
analysis frameworks or statistical techniques or both.
·
Drawing conclusions. This involves either making
recommendations for modifications to the system or making generalized
observations and further proposals for evaluation or concluding that everything
is satisfactory.
[Browne, 1990, pp. 163-164]
In order to
evaluate adaptive systems these steps could be followed but, aside from that,
it must be kept in mind that evaluating adaptive systems is not the same as
evaluating regular interfaces. Finding the most appropriate method to evaluate
an adaptive system is difficult because of the nature of adaptive processes. If
comparative evaluation is used to test the effectiveness of the system, this
will usually be done against a non-adaptive, static system. Adaptive systems,
by definition include many possible instances, which forces their homologue
static systems to developed each of these instances in order to fully evaluate
the effectiveness of the adaptability [Browne, 1990].
There are several techniques to
evaluate adaptive systems that are similar to those applied to non-adaptive
interfaces. The first of these
techniques is to use the metrics that were developed in the project development
process that represented the categories of data essential to adaptive
systems. The following are an example
of metrics that could be part of evaluating an adaptive system, where the
metrics are set in the development process of the project:
·
Objective metric.
Given the objective of creating the adaptive system, the evaluation
is done in terms of this goal. For
example, is the objective of providing the adaptive interface was to allow
users to make selection more quickly, than the system could automatically
measure the time that it took the user reach his/her goal, or the time could be
measured manually as well.
·
Theory assessment metric. The example of this technique is the theory
that positioning frequently selected items at a high level in the menu
hierarchy will reduce the time spent accessing selections. This is not only in terms of time, but also in
keystrokes necessary to reach the goal.
The number of keystrokes per selection has to be recorded as well as the
time per selection in the objective metric.
·
Trigger metric.
This technique is based in the assumption that knowing the successful
selections made by users can be used effectively to improve interaction
speed. Therefore, this technique makes
use of the selections made by the user and this information is used to create a
history for each user and use it to measure the speed of interaction between
the user and the system.
·
Implementation metric. This technique includes the delay when calculating the
probability distribution before updating the user interface. In other words,
this is the time it takes the system to generate the adapted interface
dynamically.
[Browne, 1990, pp. 173-174]
By relating
different metrics it is possible to evaluate whether an adaptation was made
successfully or not. For example, to
describe how the adaptation will behave we might look at the relationship
between the Trigger metric and the Implementation metric.
Another technique for evaluating
adaptive interfaces is called Niche Description. This technique allows the designer to describe the implications
of their design proposal with respect to both the benefits that the adapted
interface will give the user and its relationship with the user’s
characteristics.
The significance of evaluating an
adaptive system is that it demonstrates the importance of being able to measure
the behavior of individual parts of the system in order to understand the
performance of the system as a whole. The evaluation step of an adaptive system
is important in order to know if it is achieving its goal effectively and
weather it is using the user’s information effectively.
There are two
basic ways in which a system can be adaptive. First, the system may concentrate
on dynamically generating the different pages that compose the site in order to
allow modifications for individual visitors: customizing pages in real time to
suit the needs of a specific user. Second, the system may focus on non-dynamic
modifications, also known as offline global improvement: altering the
underlying structure to make navigation easier for all [Perkowitz and Etzioni, 1999].
Dynamic modifications
for individual users can be an effective tool for improving Web
interfaces. Generating Web pages
dynamically according to user information may be done in several ways, by
various means of adaptation.
One way for a site to
respond to particular visitors is to allow manual customization: allowing users
to specify display options that are remembered during the entire visit and from
one visit to the next. The Microsoft Network, for example, allows users to
create their own customizable home pages, displaying their desired news and
information. Every time a user enters his/her MSN home page they get news and
information in their already customized environment [Perkowitz and Etzioni, 1999].
Path prediction, on the other hand, attempts to
predict where the user will want to go in order to take him or her there
quickly. The WebWatcher System [Carnegie Melon University, 2000] predicts where
the user will go on a particular page by mapping the content of the page and
links to user interests. A link that
WebWatcher believes that the user is likely to follow will be highlighted,
enlarged and placed at the top of the page.
In order to develop this system, visitors were asked what they were
looking for when they got into a page and just before leaving the home page
they were asked if they found what they were looking for. WebWatcher recorded
the path of users that answered correctly to this question in order to know
what type of links visitors follow when looking for certain information [Perkowitz and Etzioni, 1999]. Instead of predicting
the user’s next action based on the actions of many visitors, another
possibility could be to predict the user’s final goal based on what he or she
has done so far, by viewing path prediction as a plan recognition problem. Plan Recognition is the problem of
identifying, from a series of actions, what the user is trying to
accomplish. Experts accomplish this by
monitoring user behavior and actions in a system. Assuming users behave somewhat rationally, experts use their
actions to forecast from what the user has done, what he/she is trying to do.
In a Web system it may be useful to observe a user’s navigation through the
site and try to determine what page(s) he or she is seeking [Perkowitz and Etzioni, 1999].
Other means of adaptation exist and include
Content-Based Prediction and Multiple User Data Collaboration. Content-based
collaboration uses what the user has read in order to predict what he/she is
looking for. The system analyses the co-occurrences of words in different documents
that the user has visited and advises the user about which links to follow,
what information to look for and where to get it.
Adaptation by multiple user data collaboration is
done by gathering information from different users with similar preferences and
analyzing them in order to reach a conclusion about what the user information
goals might be. Each of these approaches, of course, maps user information in a
certain way to allow the system to present information to the user in a more
personalized way, allowing the user reach his/her goal faster.
When it comes to
color there is a subtle relationship between usage and effectiveness. Its use
conveys many implicit meanings to the reader and enables the developer to
convey importance and relationship without explicitly stating it. Researchers
agree on some major guidelines. What we have included here are by no means the
only rules of such sort but instead represent what we have found to be common amongst
authors.
·
Use color sparingly: The less frequently color
is used the better it will grab the user’s attention. For example, when it
shows up, the user will immediately associate the color red with warning. Once
you use red to warn the user, don’t use it for any other purpose. “Colors are
effective maximally when used minimally” [Najjar, 1990].
·
Use color consistently: Due to culture and
experience we tend to expect colors to mean different things. A common meaning
is that used in streetlights and cars. Red, yellow, and green have such
profound meanings in most societies that it’s difficult to break these
associations. Failing to comply with these obvious relationships might yield
misinterpretations and mistakes.
·
Use colors
that contrast well: The
opposing color theory
applies to perfection here: colors that lie close to each other in the color
spectrum do not contrast well enough, making it difficult for the reader to
focus comfortably. Some examples of good contrasting colors are blue-yellow,
and red-green; but avoid using non-opposing colors, such as blue-green and
yellow-red.
·
Avoid
saturated colors: Except for warnings, one should avoid saturated
colors since it can produce visual fatigue. Color differentiation is done with
different muscle movements; scaling up the saturation of colors only increases
the work done by the user’s eyes.
Some other guidelines and
suggestions have been noted and merged in throughout these definitions. Other
rules one must follow include:
·
Pure blue should be avoided for text and thin lines;
·
Avoid adjacent colors that differ only in the amount of
blue;
·
Avoid edges created by color alone;
·
Avoid red and green in the periphery of large-scale
displays;
·
For color-deficient (color blind) users, avoid
single-color distinction;
·
Use bright colors for danger or for getting the user’s
attention;
·
Keep the number of colors small (7 ± 2);
·
If possible allow users to select their choice of
colors.
[Shneiderman,
1998][Human Factors International, 2000]
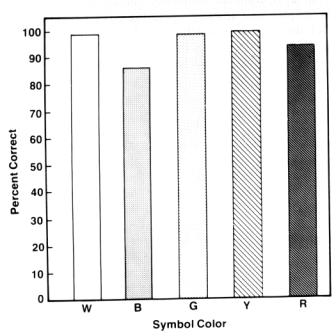
Symbol
Color: The color in which symbols appear does appear to have some
effect on symbol legibility. However, the effects are not always consistent.
Figure 1 shows the results of a study reported by Meister and Sullivan [1969]
that examined the relative legibility of seven colors as a function of symbol
size. White, yellow, and red symbols were read at the highest rates, while blue
symbols revealed an obvious performance decrement. Performance for all colors
increased with symbol size. Silverstein discusses a similar study by Shurtleff
[1980]; its data is presented in Figure 2. This reveals that symbol
identification accuracy was best for white and for colors near the center of
the spectrum (green, yellow). Blue on red were slightly worse [Durret, 1987].
Figure
1. Performance in
reading individual color-coded alphanumerics as a function of size and color
[Silverstein, 1987, pp. 50]
Figure
2. Symbol
identification accuracy as a function of color [Silverstein, 1987, pp. 50]
Symbol Color
Contrast: No revealing data has been found for contrast’s effect on
readability but it is known that contrast enhances discrimination amongst
targets; it might be expected to contribute to display readability as well.
Color and
Symbol Density: Color is believed to be at least as effective as any
other coding method for reducing visual search time on complex displays. The
advantage for color-coding performance increases as the amount of symbol
density increases. The target’s color must be known in advance in order for the
search to be time-successful, and character density level appears not to affect
performance when color is used consistently (see Figure 3). When the searcher
does not know the target’s color, performance with color displays is inferior
to searching without color [Durret, 1987].
Some other
pertinent data is that search time on color-coded displays increases as the
number of display items of the target’s color increases. Second, search time
also increases with the number of differently colored items. Third, given a
significant color difference between target and background items, the number of
background items has no effect on the search performance.
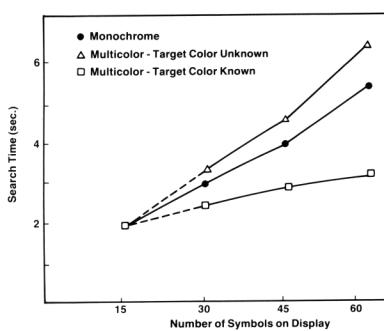
Figure
3. Time to locate targets as a function of
color coding, symbol density, and knowledge of
target color [Silverstein, 1987, pp. 56]
Irrelevant
use of Color: Even though the use of color aids a user’s task for most
situations, unnecessary color usage is not advantageous. Adding color to a
monochromatic interface in such a way that color does not convey any meaning
yields a longer search time than that of a monochromatic display. A study by
Krebs & Wolf [1979] shows results after testing color in relevant and
irrelevant ways (see Figure 4).
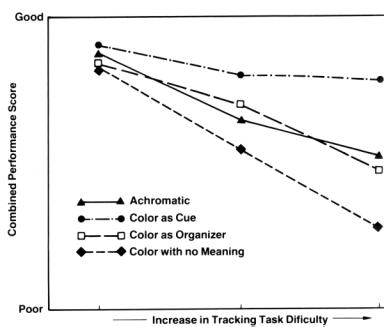
Figure
4. Relative effects
of task difficulty on performance of simulated piloting as function of
different methods of color-coding [Silverstein, 1987, pp. 57].
Developers organize and
design screen interfaces to optimize the efficiency of visual access. This is
mostly done by following standards such as complying with the left to right
and, top down scheme with which most western societies are used to working.
Some immediate guidelines appeal to all users while some don’t. Differences
will always exist but the essentials seem to remain the same. Here are some of
the more commonly agreed-on formats and suggestions:
·
Follow standards: Users can often be trained
to know where things go and the purpose or meaning behind these locations.
Continuously following a pattern of use will comfortably acquaint the user’s
interactions with the system.
·
Match common eye movements: Many languages in
the world are read with; left to right and top down eye scanning (see Figure
5). Accommodating an interface to comply with this scan direction will further
ease the completion of the task at hand.
Figure
5. Eye-scan, Human
Factors International
·
Left Justify fields and labels: Left justified
labels and text are more common and physically easier to read compared to right
justified. One of the exceptions is when numbers are being compared, where they
should be right justified on the decimal point.
·
Use sufficiently large icons and buttons: Increasing
the size of action targets in the screen will increase the speed with which the
user enables such action. One must sometimes sacrifice space and size depending
on the desired goals.
A
static model is one that does not change, and which is applied to all users.
The only way in which the user’s differences are captured is in terms of what
parts of the model are set or enabled. This is probably the most
simplistic modeling method but one must not believe that this method is at all
inaccurate. Vast differences amongst users can be accurately described by the
use of a single, complex static model [Browne, 1990].
A more common approach is the utilization of two models. One is static
and not updateable while the other may be a static updateable or dynamic model
that characterizes some dimension or dimensions of user. The result of
comparing these two models provides a basis for the user interface changes
[Browne, 1990].
Rather
than comparing models in order to classify user, a number of rules can be used
to choose a model that best characterizes a user. These models are themselves
static, mirroring characteristics of the users that they are describing. Unlike
comparison modeling that anticipate changes within the individual, alternative
models assume long term individual characteristics. Of course, by testing the rules more frequently during
interaction, the behavior of the model will be similar to that of a comparison
model. The choice depends on the anticipated duration of the characteristic and
the confidence in which the developer chooses one model over another [Browne,
1990].
These models describe the tasks or plans that a user might be expected to
attempt, but they take no account of individual differences. At a top level,
the model may consider a user’s goal one of learning a query system or a new
command language, intermediate goals are derived by using a model of the tasks
the user wishes to accomplish. The identification of such intermediate goals
would then allow the provision of a user interface that encourages the
accomplishment of the user’s immediate goal. This method has been used with
mixed outcomes.
One method commonly used to analyze if this method will be successful is
to record user interaction in the application domain of interest. While the
recording is running the designer should attempt to second guess what the user
will attempt subsequently, that is, identify their goals. If they have little
success, then it is unlikely that the developers will be able to produce a plan
recognition based user model that will be successful [Browne, 1990].
Possibly one of the simplest means of modeling for an adaptive interface
is to employ usage models. Such models pay little or no attention to user
differences at any level other than the usage made of information within the
system. That is, they pay no attention to intrinsic user differences. An
example of this method would be to re-organize an online service, in
particular, its hierarchy of menus. Changing these links would decrease the
number of key or mouse selections required to retrieve frequently accessed
items of information [Browne, 1990].
It is not easy to
reach a conclusion about the effects of color and layout adaptations on how
fast or easily a user reached his/her goal when navigating through a Web
site. There are many steps that have to
be taken in order for such a conclusion to be reached. This is why a methodology has to be
developed, one that defines the steps that are going to be followed and how
each step relates to another.
The following sections
describe the steps that we followed to achieve our objective. During this Major Qualifying Project, the
way in which the conclusion was going to be reached changed dramatically until
it was clear what our goal was and how we were going to reach it. All these changes can be seen in the
following methodology.
According to our research,
it was very important to choose wisely what the Web site was going to communicate
through its interface [Nielsen, 1998].
This content must be unambiguous, should contain different topics and
several ways of retrieving some information.
The web contents should be unknown to the user so that he or she has to
browse through the site in order to find the answer. The given text should be
reduced in its complexity, allowing the users to achieve their goal faster
depending on the layout and color adaptation, and not on its difficulty.
In order for us to
determine the effectiveness of our system it had to be tested correctly with
real users. We chose tasks that had to be completed by navigating through the
Web site. These tasks had to be easy to measure and should allow us to gather
as much statistical data as possible from the navigation of the site. For our system to be able to adapt layout
and color it must know the user’s goal.
This is why we chose a task that could allow multiple goals.
Adapting layout
and color requires the use of information gathered about the user. Adaptations
are done because different users work faster if they can relate their knowledge
about a subject to the information itself and its display. There is also a lot
of information that we can obtain from the user, such as knowledge, age, and
experience. Not all the possible
characteristics that we can gather about a particular user will enable us to
adapt layout and color; hence we must only gather the most relevant.
Prior to
determining what part of the information about a user we will use, we had to
formulate all the possible ways of adapting color and layout. In this way, we
were able to determine the user information that was relevant for the
adaptations.
After
distinguishing the different ways of adapting color and layout we needed to
clearly define what user information is important for each of these types. Each
type might be affected by more than one of the user’s characteristics and each
of them could affect the adaptation differently.
At this point, we
had the different types of adaptations and the user information that affected
each of these changes. We then had to establish the relationships between the
two and summarize them into a table for easy understanding and analysis.
Initially, in the proposal
stage of this project, we were going to generate pages dynamically by using the
information gathered about the user. Consequently we had to concentrate on how
the system would adapt with respect to color and layout, and what it should do
in order for it to be testable and measurable.
However, later in the project it was decided that the pages would be
created and adapted previously, creating a static Web site. This meant that
these adaptations had to be defined.
First we found out
what all the possible combinations of adaptation were within one category and
between categories. For example, it is possible to adapt a system by using
color to highlight importance and relationship. It is also possible to adapt it by using color to highlight
importance and using layout to display information in a sequence according to
user’s interests.
When designing the
experiment it was also important to keep in mind the order in which the results
of the combinations are achieved. For
example, knowing that layout adaptation A combined with color adaptation B
yields a positive result does not mean that combining the adaptations in the
opposite order will yield the same result.
During our experiment we
wanted to keep our users as comfortable as possible. One of the many means to
achieve this goal is to limit their interaction with the system by reducing the
number of experiment phases, only presenting them with the most meaningful
ones. Since the possibilities are numerous we needed to first examine these combinations
and omit the more obvious so that the ones actually used are those that give
more valuable information. Reducing the
number of experiment phases is useful because the user will not get annoyed or
tired, but it will also isolate the user from any intrinsic learning. It will also reduce the possibility of
getting the user too acquainted with the system, learning about it and
consequently jeopardizing the controlled experiment environment.
The design phase was probably the most
important part of the project since it was here that we defined each one of the
components that comprise the whole project.
There was the Web site, the system gathering the results, and the
experiment that was conducted to prove our hypothesis. We will describe our design methodology,
starting with the Web site and finishing with the experiment.
The Web site design had to begin with the
definition of its requirements; these were the starting point for the rest of
the design phase. After the requirements
were defined, the rest of the process for the Web site design was
straightforward, since the content and the adaptations were defined previously.
The second component that had to be designed was the system that
gathered the results. It was important
to have a good design of this component since it interacted with the other two
components of the project, the interface and the experiment itself, and because
if it were to be poorly designed it may cause the whole experiment to slow
down, forcing the user to spend more time experimenting with the system.
Finally, after having the Web site and the
data gathering mechanism, we designed the experiment. What were the
requirements? How was the user going to progress through the experiment? Was
there only going to be one type of experiment? These were the questions that
had to be answered in the design phase so that the implementation would be
easier and more straightforward.
The implementation phase
was not only limited to programming. We also had to follow several steps
including establishing the requirements, developing a user model, developing
use cases and scenarios, implementing a “generic” Web site and finally
implementing the program that dynamically generates the adaptations of color
and layout. This last one was our initial idea for the project, but had since
changed to the development of four static Web sites with adaptations made to
each of the necessary pages. The
implementation phase was also divided into three stages, the implementation of
the Web sites, the program that gathered the data from the experiment and the
experiments themselves.
The first step was to
establish the requirements. This was done by analyzing the results obtained
from the previous steps in our methodology and by discussions between the group
members and our advisors. The
requirements define the expectations and objective of the system that was
built, providing guidelines to follow and a goal to achieve when developing the
final product.
Initially we needed to know
which information about the user we were to gather in order to adapt color and
layout. Since the project was not going
to involve generating pages automatically, we did not need to make a
relationship between the user information and the Web site.
In order to know what are
the components of our system and what the sequence of events were going to be,
we studied all possible scenarios. These were use cases that described in
detail what were the possible alternatives that a user could follow when using
our system.
After establishing the
requirements of the system, how the user information was going to be stored and
retrieved, and how the experiments were going to be conducted, we had to
develop what we called the generic Web site.
We first implemented the
static Web sites with color and layout adaptations built into them. The adaptations for these Web sites had to
be created according to the specific task that the user was going to undertake
in the experiment, so that the adaptations could have either a positive or
negative effect in the navigation time and comfort.
Finally, before
conducting tests with actual users we first tested the system for bugs. There are many ways to evaluate an adaptive
system and some of these were mentioned in the literature review. We developed
a strategic way of evaluating the system: we carried out limited usability
studies with WPI students prior to the actual development of the experiment,
which informed us of what could be anticipated for the future, such as data ranges
and possible programming errors.
In the experiment
we had the students complete three simple tasks, while simultaneously gathering
large amounts of data. We then analyzed this data in order to conclude on the
effects that color and layout adaptations have on a user task completion.
Before actually gathering
the results, we first made sure that the format in which we were gathering
results fit the format that could be read by the statistical package,
Statistica 98, used to do
the data analysis. We also decided how the data was going to be separated and
displayed in the analysis package, and how it was to be imported into the
software used to create the figures for this report, namely Microsoft Excel.
Finally, the last
step in our project was to analyze the data gathered from the experiment. This was probably the most important part of
the project. After the data was
analyzed the conclusion was reached about the effects of color and layout
adaptations on the speed and ease of navigation of a Website.
The data analysis
that was conducted reflected how we defined the experiments, and the many
different experiments or sub-experiments.
There had to be an analysis of what difference it made to conduct a task
using a non-adapted site versus an adapted one, both in color and in
layout. These relationships had to be
defined in order for the data to be analyzed.
After analyzing
data, we reached conclusions regarding the effects of a Web site’s color and
layout adaptations. This conclusion is
stated in the final section of this report and supported by the analysis of the
data obtained after running the experiments.
If we were going
to measure any performance improvements in our users, we had to first simplify
things by reducing any stress on the user. One source of stress was that they
had to deal with a new Website and what that entails. We found that during the
first few minutes of the user-interface relationship it was usual for much time
to be lost while the user was getting to know and understand the Website.
However, when an interface is modeled using common and well-known
relationships, users tend to anticipate what the site will offer. By the same
token, developers can assume that the user will invest little or no time
understanding the details behind the system and still perform well
[Shneiderman, 1998]. We knew that our site had to be obvious enough so that the
user would reduce the time normally spent on getting to know the site, and
instead concentrate on running the experiment.
Upon establishing
the requirements for our interface we then decided on the contents to be
displayed. Several possibilities were taken into consideration, some of which
are worth mentioning. The first proposed was to use our Literature Review
content as the backbone of our experimental site. A major problem with that was
that besides possibly being boring for the user, the control factor of our
experiment might be affected. Users could read about the measurements that were
getting recorded and could in some way adjust their behavior. A second proposal
consisted of some sort of encyclopedia. This idea was turned down fairly
quickly when we realized that it would be time consuming to gather the
necessary data. Our last possibility prior to the one we finally decided upon
was to use the WPI Computer Science Department site, but this idea was
abandoned as soon as we realized that some of our users would have seen this
site and used it prior to our experiment, while some others might not, again
affecting the control factor.
The 2000 Sydney
Olympics Website appealed to us for of three major reasons: first, this site
was developed by the IBM e-business team, which is an experienced group of
developers in the Internet area; secondly, this site was written using
easy-to-understand language, since by default they tried not to alienate any
possible visitors. Furthermore, its text was non-technical and not specific to
any specific topic, making it neutral and common for most of our users.
Thirdly, this site was structured to some extent in the way we envisioned our
controlled experiment, as a wide tree of nodes, beginning with one parent and
branching off in balanced manner.
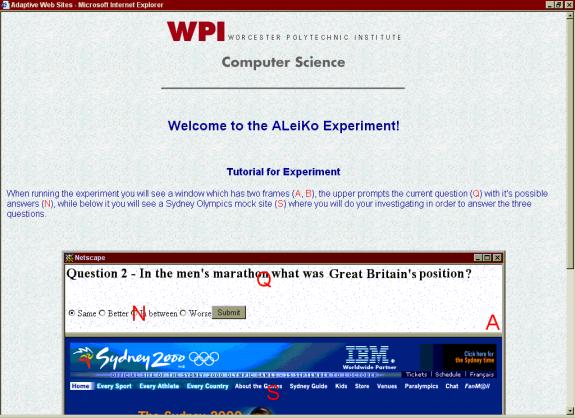
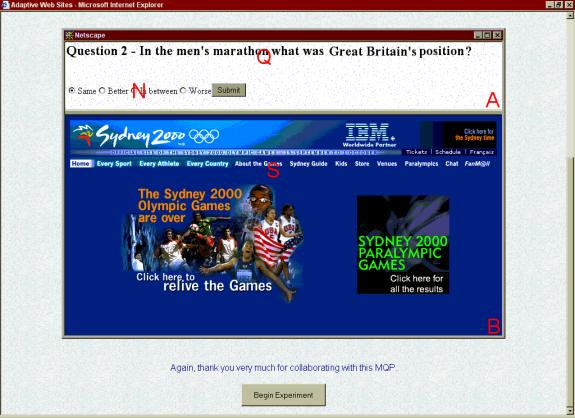
The experiment was
designed in such a way that the user would have to complete a task found in a
site. The design had two frames, an upper one containing the question at hand
and its possible answers, while below (in the second frame) one would find the
Olympics site where all the answers were.
When using two frames there are two choices, up-and-down or
left-to-right design. We chose the first since we believe it to be a more
natural and comfortable way of doing this specific task. A more obvious gain
when designing it with frames was that users would not have to toggle between
two active windows (one containing the site while simultaneously another would
have the experiment’s questions and answers) causing some aggravation, not to
mention time loss.
According to our
research, in order to obtain meaningful data we had to test a substantial
number of subjects (in the range of one hundred)[Nielsen, 1998]. For any
statistical analysis to be significant one must account for errors by
increasing the data pool. Consequently we designed our experiment to deal with
as many subjects as possible. In order to organize and serve these users we
chose an Internet-based experiment that could offer a wider access area, and
also accurate measurements recorded online. This decision would not only be
comfortable for the users that could visit our experiment from anywhere and at
anytime, but it also relieved us (as experiment conductors) from having to
reserve labs at special times for their use and having to be present during the
experiments. We also believed that if the experiment were on the Internet it
could be run whenever the students chose to be, and therefore increase the
final turnout.
Some
considerations had to be made about the language that was going to be used to
gather all the necessary data from each of the experiments so that the best
suitable programming language could be used for the job. We knew that we had to gather the number of
clicks, the time, and the answers to each of the tasks that the user would have
to perform in order to finish the experiment.
The programming
language options were limited to just two: Perl and JavaScript. These were the
ones that both the project members were familiar with and the ones that would
take less time to start programming.
Comparing Perl and JavaScript yielded Perl as the final decision of
which programming language to use for the following reasons.
The
most important reason why we chose Perl is that it can handle operations with
files, including opening, closing, writing and reading on the server side. This was a very important feature needed
since all the data was going to be written to a file when the user was done
with answering the questions. Also, each task (question) was going to be read
from a file located on the server side.
Other
features that were needed from the programming language was the ability to
handle cookies, to generate HTML dynamically, and to get information from
forms. All these were possible with
both JavaScript and Perl but since the most important feature needed (file
access) could only be achieved using Perl, it still remained as our choice.
Perl is to our experience a little slower than JavaScript when handling
features that both languages support, but Perl has a very fast and reliable way
of parsing through files and writing to them, again, an important element in
our project.
Finally,
a very important feature that Perl has is that whenever a request comes to the
server for a specific script, the server creates a separate process. This means
that no two (or more) users will have synchronization problems.
Color was chosen
as one of our adaptations, as it is easy to implement, and according to our
Literature Review, one of great importance when conveying implicit information
such as order, magnitude, relationship, etc. The use of color in this
experiment was limited to the enhancement of relationships (namely grouping and
order).
The second
adaptation is not that obvious, and that is the page layout. These adaptations
require great study and are not as easily implemented, but nevertheless seem
important enough to study their effect, both by themselves and in conjunction
with those of Color. Layout can easily make specific information more
accessible to the user. It can convey importance and order when dealing with
vast amounts of information (e.g., data positioning in a list).
The experiment is
divided into four parts. The first was entitled “Experiment Briefing” where we
convey overall details a student needs to know before starting the experiment.
We included information such as what the site is about, what Internet browsers
seem to work best, and what to do in order to receive compensation in their
classes (if they were referred by one of the three courses
we were able to use).
This part leads to the
second part, which we labeled “Tutorial”. Here we included a screen capture of
the actual experiment and labeled the typical interface elements. We singled
out the area where the users will be prompted for the task, where the
multiple-choice answers will appear, and where the “actual” site (2000 Sydney
Olympics mock site) is. We wanted to acquaint users with the experiment so that
the first question would not reflect any performance slowdown.
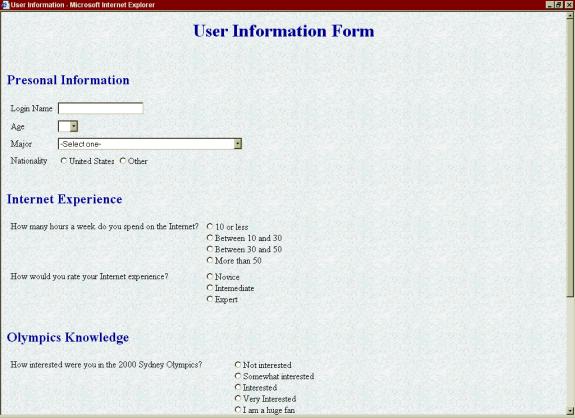
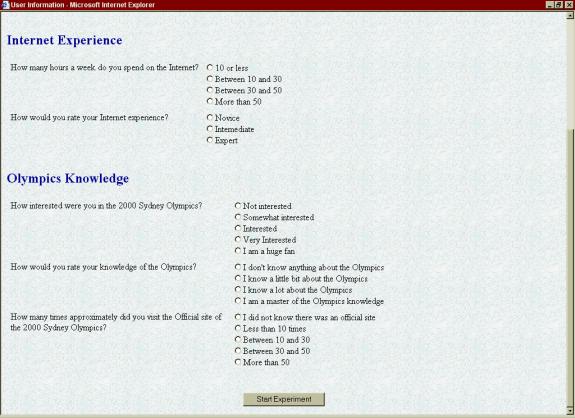
Afterwards, the users fill
out a “Demographics” form. Here, most of their background would be recorded,
information such as: age, major, username, and citizenship. We also chose to
ask them about their Internet and Olympic knowledge. Even though this entire
section’s information cannot be mapped to any performance data recorded (we
intentionally did not related these for privacy reasons), we believe that this
information adds meaning to the overall data analysis.
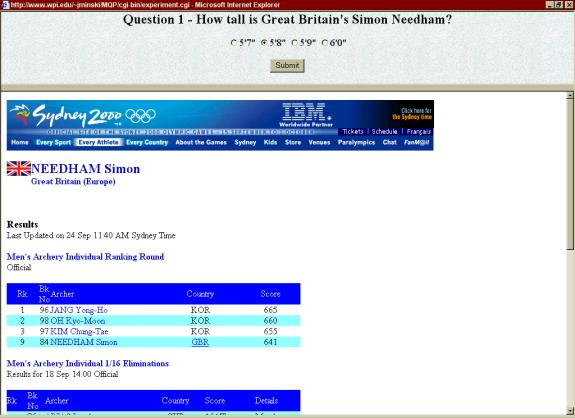
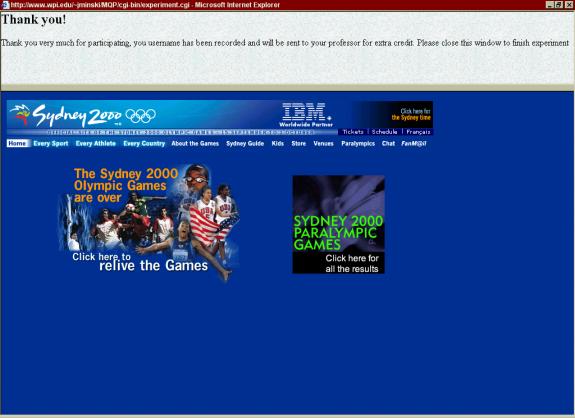
Upon completion,
users would then enter the “Experiment” section. As soon as each question is
presented to the user, he/she has to surf the lower frame (the Olympics site)
and fetch the answer to the task at hand. Every link-click selected by the user
is recorded, as was the time from “question-prompt” to “question-finish”.
Recordings were made three times, once for each question. As soon as the third
question was answered, the user was thanked for his/her time and informed that
his/her username had been saved. The statistical information that had been
recorded before was actually saved at that point, when the user had
successfully finished the last task. This would filter out any incomplete data
that otherwise would have been recorded.
Before actually
conducting the experiment, we had to decide how we were going to conduct it,
that is, whether the experiment was going to be placed locally in a lab, on the
WPI network, or whether it was going to be available to any person through the
Internet. We created a table evaluating
the different aspects that were important for conducting the experiment. We assigned equal weights to these aspects
and then revised them according to our perceptions of the importance of each of
these to our project. These aspects, include security, control, and others, were
recorded in a table and then totaled for both the Lab and Web choices to allow
us to decide on the environment that was going to be used for the experiment.
|
|
Importance to the project (%)
|
Web Rating
(out of 5)
|
Subtotal Web
|
Lab Rating
(out of 5)
|
Subtotal Lab
|
|
Security
|
14.0
|
4
|
0.6
|
2
|
0.3
|
|
Control
|
18.0
|
3
|
0.5
|
5
|
0.9
|
|
User Willingness
|
16.0
|
5
|
0.8
|
3
|
0.5
|
|
Gathering Results
|
14.0
|
5
|
0.7
|
3
|
0.4
|
|
Number of users
|
12.0
|
5
|
0.6
|
4
|
0.5
|
|
Maintenance
|
14.0
|
5
|
0.7
|
2
|
0.3
|
|
Speed
|
12.0
|
4
|
0.5
|
5
|
0.6
|
|
|
|
|
|
|
|
|
Total
|
100.0
|
31
|
4.4
|
24
|
3.4
|
As it can be seen
in the table above, conducting the experiment in the Web was more convenient
not only for us, but also for the participating students. Therefore, placing the experiment on the Web
could give us more data to work with because more students would be willing to
experiment with the system.
Because the 2000
Sydney Olympics Web site that we used had to be modified (to reduce its
complexity and ensure control over its organization) we aimed at achieving a
well-designed tree arrangement. In “Designing the User Interface” [1998],
Schneiderman recommends the usage of broader rather than narrower trees.
Furthermore, he encourages designers to limit trees to three levels in depth:
“…when depth goes to four or five, there is a good chance of users becoming
lost or disoriented.” [Ibid, pp.
249]. We have not only complied with
Schneiderman’s guidelines about depth, but also adopted his width recommendations.
He mentions that better productivity (speed, accuracy, preference) occurs when
users encounter at most eight nodes (in its leaf level) in a two level deep
tree.
|
|
|
|
|
 |
|
|
|
Figure 6. Web Site Structure
|
|
As seen above in
figure 6, our design consists of a one-seven-four arrangement that differs to
that of Shneiderman in that he postulates a three-eight layout. We believe that these changes did not
sacrifice efficiency since the underlying structure is still a short, yet wide
tree.
After
defining the general structure and complexity of the Web site, it was important
to design each of the tasks that were included in the experiment. In order to obtain less of a learning curve
from the users, we had to select the tasks in such a way that the answer to the
question was placed on a considerably separated leaf node in the Web site structure. Furthermore, the tasks had to be challenging
for the users and require them to browse in order to answer correctly.
Additionally,
it was very important to choose tasks such that finding the answers could be
enhanced by color and layout adaptations to the Web site, thus allowing us to
prove our hypothesis that a Web site with color and layout adaptations yields a
more successful task completion.
The
following are the specific questions that were included in each task, answers
to these, and the appropriate adaptation in the Web site:
- If you were to attend any sport during September 18, which would
have been the most expensive? (Both adaptations)
- Weightlifting
- Gymnastics-Artistic
(correct answer)
- Badminton
- Boxing
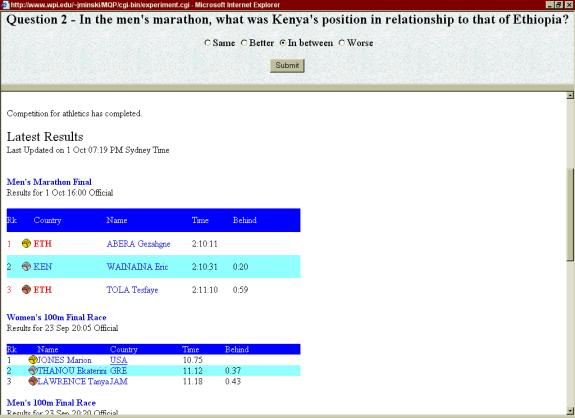
- In the men's
marathon what was Kenya's position in relationship to that of Ethiopia?
(Color/Layout adaptation)
- Same
- Better
- In between
(correct answer)
- Worse
- If
the Olympic games could be a competition between continents, which
continent would the Russian Federation represent? (No adaptation)
- Africa
- Asia
- Oceania
- Europe
(correct answer)
- How tall is Great
Britain's Simon Needham? (No adaptation)
- 5’7’’
- 5’8’’ (correct answer)
- 5’9’’
- 6’0’’
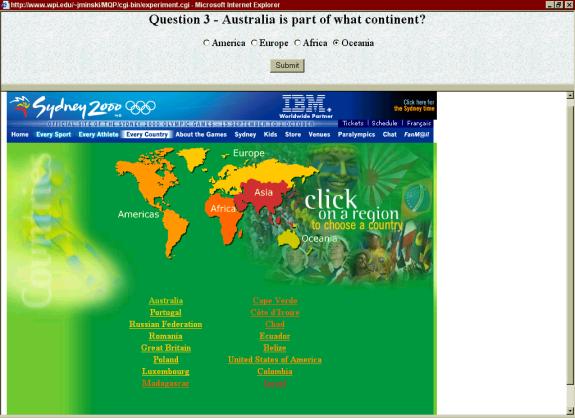
- Australia is part of what
continent? (Both adaptations)
- America
- Europe
- Africa
- Oceania (correct answer)
(For details on each of the task
adaptations see Appendix E)
The measurements
will either prove or disprove our hypothesis by highlighting the effects that
adaptations had on the users. In addition, the data can be analyzed to
determine whether the changes improve users’ productivity. To do this we had to
define and limit the definition of “productivity” in our experiment. For us, it
means that if a user has increased productivity, s/he has reduced the time
needed for a specific task, and, as a possible byproduct, has also reduced the
number of clicks made.
The less time a
user needs in order to complete a task, the more productive he has become. We
expect that specific changes in a site might target this aspect. Just as time
reduction increases productivity, it is our belief that a smaller number of
clicks also correlates directly with productivity.
Time was measured
in seconds, from the beginning of the task prompt until the task is completed.
These measurements were taken three times per user, and did not discriminate
whether the user correctly answered the question. Statistical analysis will
enlighten us about this aspect of the data.
The numbers of
clicks were measured in the same way, three times per user, from question
prompt until task completion. Again, we did not discriminate whether the user
answered the question correctly or not.
Because our users’
involvement with this experiment was biased (extra credit was being earned), we
believed that their time with the system had to be minimized, hence diminishing
any possibility of them getting bored or losing interest.
We did not find a
way to reduce the already cumbersome three-minute average per task, but what we
could do was to segment the population by assigning smaller task sequences and
then assigning different versions of these to different people. By achieving
this we could limit each user to a maximum of nine minutes per experiment.
Once we decided
users would experience only a segment of what we were testing for, we had to
decide which paths were going to be presented. We designed a “diamond graph”
(Figure 7) where each of the four nodes were adaptations. In this diagram, B is for both adaptations,
C is for color adaptation, N is for no adaptation, and L is for layout
adaptation.
|
|
|
|
|
 |
|
|
|
Figure 7. Experiment Design
|
|
We followed the
“diamond” through both paths from B to N, where the heads and tails were the
same but the middle nodes differed. We decided to include the two other
possibilities, which were the exact opposites of what we had decided earlier (N
to B), hence reducing any order effect on data collected. The four paths
selected were: BCN, BLN, NCB, NLB. We
designed the experiment with one group per path.
This method of
limiting the amount of variation each user encounters and balancing it with the
other users is used widely in psychological experiments. “Counterbalancing” as
it is described in Basic Principles of Experimental Psychology by Otto Zinser
[1996], is the method used in situations in which two or more treatments are
administered to each subject. Its function is to control sequence effects:
order effects and carry-over effects. When detailing a three-test examination,
Zinser describes exactly what was done in our research. Furthermore, this
method relieves the researcher from analyzing the data statistically in order
to find if that data has been corrupted due to the effect of order.
An important part
of our study was to realize that the users in this study are by no means
representative of the entire population. Therefore, we had a clear
understanding of some of the assumptions we could make when developing,
designing, and implementing this experiment.
An essential
assumption we made from the beginning was that all of our users had a clear
understanding of the English language (more specifically of written English).
Our basis for this assumption is that WPI does not enroll any non-native
English speaking students that do not successfully pass the TOEFL [WPI, 2000].
Internet and
computer basics were also assumed, however this hypothesis cannot be proven
from our data. The repercussions of this assumption can be seen in the
introduction portion of our experiment, were we decided not to overwhelm our
users by explaining to them the details of Web surfing. One good basis for this assumption is that
all of our students in the experiment were drafted from Computer Science
courses.
According to The
Digest of Education Statistics [1999] our subjects ranged in age from their
late teens to their early twenties. From this, we could then assume that they
knew, at least vaguely, what the Olympics games deal with. This fact relieved
us from having to inform them of what the topic is about and what they might
encounter later on.
The system takes
the user through the experiment and that also gathers all the necessary
information from the users’ experimentation.
Data containing the answer to the questions, the number of clicks and
the time it took the user to answer each question were gathered by the program
that was running in the background while the user went through the experiment.
The
program includes four CGI scripts developed using Perl, which wrote to and read
from four different cookies on the user’s computer, and wrote to and read from
four text files located on the server side. These files contain the final
information gathered from the experiment.
In the following section, we will describe exactly how each script works
and how it gathers the information necessary to achieve our objective in this
project.
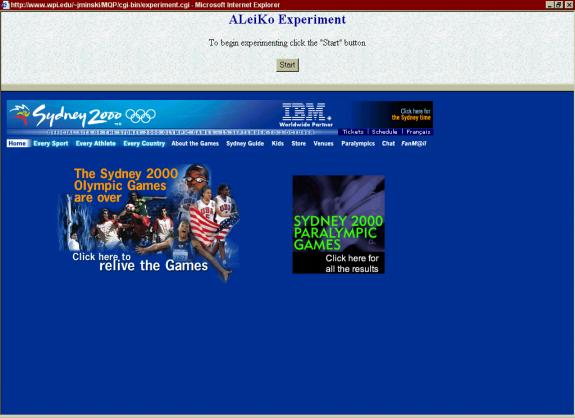
When
the experiment starts, the user gets a briefing that serves as an introduction
to the experiment, explaining exactly what he or she is about to see and some
general information about the project that the user might be interested in
knowing about. Then the user is taken
through a tutorial that shows a preview of the experiment and of the interface
and how they are supposed to conduct the experiment.
Experiment Cookie Time Cookie Answers
Cookie Clicks Cookie
Experiment
Briefing
Aknowledgement page
 External link
 Flow
of information in the direction the arrow is
Flow
of information in the direction the arrow is
pointing

Figure 8 Implementation
Diagram
|
|
Next
node in the sequence
Before
the user starts experimenting with the interface, the user is prompted to fill
out a form, which was implemented with HTML. This form requests the user for
some basic personal information and some information about his or her knowledge
about the Olympics and experience browsing the Internet. After this form is filled, the program
starts working on the background and the interaction between the scripts, the
cookies and the files start occurring.
The
first script that runs in the background is the direct.cgi script. This program is invoked when the user
submits the information from the user information form. This program stores all
the information entered by the user in appropriate files. The usernames are stored
by themselves and the rest of the information is stored in another file. After
all the information is entered into the files, this program generates a random
number using the ‘rand’ function already implemented in the Perl library. The
number generated by this function call corresponds to an experiment path that
the user will follow in his or her experiment. This is implemented by storing
the group number and group URL into an experiment cookie for its future use in
the experiment.
The
direct.cgi script redirects the user to the experiment.cgi script, this script
puts the different pieces of the experiment together, the upper frame or the
frame where the questions will be displayed and the lower frame or the frame
where the mock Olympic site will be located, creating a very obvious separation
between the two frames so that the user does not get confused. This script accesses the experiment cookie
and reads what type of experiment was assigned to the user who is currently
starting the experiment, and depending on this, the lower frame is loaded with
the appropriate Web site.
After
all the necessary frames and pages are loaded and the user is ready to begin
the experiment, he or she must hit the start experiment button in order for the
next script to be loaded and for it to start gathering information about what
the user will be doing during the experiment. The script that is loaded is the
questions.cgi script, the script that does all the major work in gathering the
information during the experiment. This
script generates each of the question pages on the top frame and gathers the
time it takes the user to answer each of the questions or finish each of the
tasks given to the user in each stage of the experiment. The question pages on the top frame are in
HTML generated by this script, and are generated dynamically from one of each
of the four files that hold the questions to each of the four types of
experiments in our project. The script
reads each question and its four possible answers and displays them in the
upper frame for the user to start on his or her task.
This
script interacts with the ‘answers’ and ‘time’ cookies as well as with both the
questions and the results files. Each
time a user submits an answer to a question, this script stores the answer
given by the user as well as the time it took him or her to complete the
task. The time is calculated by calling
the ‘localtime’ function when the task starts and when the user submits an
answer and calculating the difference between these times. The task times are stored in a time cookie in
the client computer. The answers to
each of the tasks are also being recorded in an answers cookie, which at the
end holds the answers to each of the three tasks done by the user.
Meanwhile,
in the lower frame (where the Olympic mock site and where the user finds the
answers to the tasks that he or she has been asked to complete), each of the
hyperlinks are directing the user to a CGI script which gathers the number of
clicks that it takes the user to achieve its objective in the task. This means
that each time the user clicks on a link, a file called counter.cgi is loaded.
It increments a counter in a clicks cookie which records the number of
clicks. After the answer to each task
is submitted, the questions.cgi script gets the number of clicks currently in
the cookie and sets the counter back to zero and starts the process all over
again.
Finally,
when the user has completed the three tasks the questions.cgi script generates
the file that contains the results for that user. The results are placed in one of four different files, depending
on the type of experiment that the user just participated in (See design
section for more details). The results
are recorded in the file starting with the answer given by the user, the time
and the number of clicks it took him or her to finish each specific task. All this data for a single user is recorded
on the same line, and a comma separates each number. This was done in order for it to be easily readable in excel, thus
making the transfer of the data from the text files to excel, and its
subsequent analysis, straightforward.
When
the all the results are gathered and written to their specific file, the
questions.cgi script generates a “thank you” page and asks the user to close
the browser window where the experiment was taking place. A graphical explanation of what was just
described can be found in Figure 8, where the interaction between each of the
parts contained in the system are shown as well as how and when each of the
scripts are loaded.
Reaching
our project objective required us to conduct an experiment where random users
were asked to answer questions whose answers could be found in a mock summer
Olympics Web site. While each user
conducted the experiment our system was gathering some data from the browsing
activity that was useful when analyzing the effects of the color and layout
adaptations made to the Olympics Web site.
This data included the time it took the user to finish each task and the
number of clicks made by the user in order to find and submit the answer to
each question.
As
described in the design section, the experiment was divided into four different
groups, where each group experimented with a Web site with different
adaptations and did different tasks.
Assigning an experiment to a person was going to be doing was done
randomly by the program, therefore, there was no criteria behind choosing who
will participate on each of the experiment types.
The
experiment was conducted with WPI students from four different courses:
Introduction to Programming, Introduction to Programming in Java, Operating
Systems, and Assembly Language. The
first group of people that experimented with the system consisted of the
students from the Introduction to Programming course, this was very good since
in theory these are freshmen and are less experienced than other more advanced
students that may be in the other courses.
The first round of testing was also useful to see if we could fix any
remaining bugs that might be present in the system.
During
the first experiment trial
there was actually a bug in the system, the program that gathered the data from
the user was using cookies that were set to expire in just one minute, which
was not enough time for the user to finish the whole experiment. This was
producing a script error and was not allowing the user to finish the experiment
in one try. This caused some data not
to be recorded. It is clear, when looking at the results that the data
collected in the first round is less accurate than after the bug was
fixed. Users that conducted the
experiment while the bug was present had the opportunity to learn more about
the page, the tasks and the questions before actually finishing the whole
experiment successfully.
In
the first round, conducted from February 5 until February 9, the we gathered
data from 50 students out of 65 that tried out the experiment. The bug previously mentioned caused this,
and some students did not conduct the experiment again after experiencing the
bug. The results obtained from these
students were very helpful in the sense that we could start our analysis and to
some extent expect similar results.
The
other courses that we experimented with all conducted the experiment between
February 12 and February 19. This made
it impossible for us to differentiate between the results from each of the
courses that participated and analyze if there was a difference between the
levels of courses that conducted the experiment.
After
all the files were closed on February 19 and no more experiments were
conducted, all the files were taken and converted into excel spreadsheets, so
that the data could be displayed and then analyzed. In this (Results) section we will show all the data that was
gathered and the graphs that were produced with this data. In section 7 we will show the analysis done
based on these graphs and other statistical analysis.
All the data
gathered from the experiments can be seen in Appendix A. There one can see
tables of each of the four types of experiments, the answers given by each of
the users to each of the tasks, the time it took each user to complete each
task and the number of clicks done by the user to complete each task. Also, in each of the tables, there is a
number displaying the number of users that got the answers to each task
wrong. If this numbers had been bigger,
than that would have needed to be considered when analyzing the data, however,
it was not significant enough to be considered for analysis.
Probably
the best way to visualize what the results mean to our project is by looking at
the graphs that the data in Appendix A generated. Appendix B contains the graphs for each of the users that
participated in each of the four experiment types. These graphs are really helpful to visualize how the time and
clicks of a certain user can be affected by the presence or the lack of
adaptation. In each of the graphs the
time and clicks are shown for each user in the experiment and differences
between each task’s time and clicks can be drawn from these graphs.
It
is not only important to see how each user behaved compared to other users and
within his or her experiment, it is also very important to make comparisons and
watch for differences between each experiment type, between different
experiments and overall between the four experiments. Comparisons between all types of experiments can be made because
of the specific design chosen for this project, described in the design section
of this paper.
In
order for us to display the results of the overall experimentation and to
display the results as comparisons between experiments we had to calculate the
average of time and number of clicks in each of the experiments as well as in
the overall experimentation. These
averages can be seen in Appendix A, where all the tables used to produce graphs
are displayed.
In
the following pages we will display the most important graphs produced by our
data, graphs that show differences between the different experiment types, the
order in which the adaptations were made, and the overall time and clicks
averages for the whole experiment.
Graph 1.
Overall Clicks Average
Graph
1 shows the average number of clicks made by the users in the whole experiment.
We are showing the differences between the different types of adaptations:
none, color, layout, and both. As it
can be seen, starting from both adaptations in the far left, until no
adaptations rightmost, the average number of clicks increased. Color adaptation was more effective overall
than layout adaptation, since the number of clicks in color was lower than in
layout adaptations.
 Graph 2. Overall Times Average
In Graph 2 we are
comparing the average time it took a user to complete a task with the different
type of adaptations: none, color, layout, and both adaptations. It is very clear that when the user was
browsing through a Web site with both adaptations it was more successful than
when doing so with no adaptations. The
difference between layout and color adaptations is again better for only color
adaptations.
Now
that we have visualized the differences overall in the whole experiment, it is important
to compare the differences between experiment types. Because of how the experiment types were designed, comparing
experiments that correspond to the opposite order of the other one is pointless
(see design section for more information on this topic). Hence we are only comparing the average time
and number of clicks between the experiments that have the same order but
differ in that one uses color and the other layout adaptation (e.g., BLN vs.
BCN).
 Graph
3. BCN vs BLN Time
Averages
Graph
3. BCN vs BLN Time
Averages
In
Graph 3, we can see the differences in average time between BCN and BLN
experiments. Both show the pattern that
the user worked faster when there were adaptations present in the Web site. However, color adaptations were more
effective than layout adaptations since the users performed their task faster
when color adaptations were present.
 Graph
4. BCN vs BLN Click
Averages
Graph
4. BCN vs BLN Click
Averages
The
average number of clicks done by the users in each of the experiments is shown
in Graph 4. It can be seen that the
number of clicks increased as there was less adaptation present in the Web
site. It can also be seen here that
color adaptation was more effective than layout adaptation because the number
of clicks when going through the Web site with color adaptations was lower than
that of the Web site with layout adaptation.
The other two
experiment types were NCB and NLB. We
also displayed the average times and clicks from each of the adaptations in
each of the experiments.
 Graph
5. NCB vs NLB Time
Averages
Graph
5. NCB vs NLB Time
Averages
In
Graph 5, we display the average time from each of the experiments whose first
task was done using the Web site with no adaptations. As it can be seen, the time decreases as more adaptations are
added to the Web site. It can also be seen in this graph that when only layout
adaptation was present in the Web site, the users were faster in achieving
their objective than when only color adaptation was present. In contrast with the graphs shown before,
where the users started with both adaptations, here the users start with no
adaptations in their first task. In the
previous graphs color was more effective than layout but in the one above
layout was more effective.
 Graph
6. NCB vs NLB Click
Averages
Graph
6. NCB vs NLB Click
Averages
If we compare the
number of clicks in the same experiments as before, the ones starting with no
adaptations, we get the same kind of results obtained for the time
averages. The average number of clicks
decreases as the adaptations increase in the Web site (Graph 6). Similarly to the previous graph, layout
adaptations are more effective than color adaptations.
In
this section we saw the most important data gathered from the experiments. This information had to be analyzed in order
for us to reach a conclusion on the effect of color and layout adaptations in
Web sites. In the next section we will
show the analysis that was done in order to achieve the goal set by this
project.
Once the experiment ended, data was collected and
then with it we had to prove or disprove our hypothesis that a Web site
with color and layout adaptations yields a more successful task completion. In this section we explain the statistical
steps we followed in order to prove it.
We will refer to the “p-level” constantly,
sometimes calling it the “significance” of specific data. The p-level is the
chance of something happening by coincidence alone, where a very small
p-level strongly supports any given data.
Because no one subject received all four
adaptations, but instead, a combination of just three, it was necessary to
analyze the data in two separate groups. One set of analysis was conducted for
participants who worked with these adaptations: Both, Color, and None.
In this set, a one-way repeated measures analysis of variance (also known as “a
one-way within-subjects analysis of variance”) was conducted for time and a
one-way repeated measures analysis of variance was conducted for number of
clicks.
Another set of analyses was conducted for
participants who worked with the Both, Layout, and None7
adaptations. As with the other analysis, a one-way repeated measures
analysis of variance was conducted for time and a one-way repeated measures
analysis of variance was conducted for number of clicks.
For all of these analyses, results
were significant at p < .0005 levels, which means that the probability of
achieving these results by chance alone was less than 5 in 10,000. These results indicate that there are
differences between the effects of each adaptation, but they do not tell us
between which adaptations there were significant differences. To test this,
“planned comparisons” were conducted; these are explained later in this
section.
First, we analyzed the
overall effects of the two Both-Color-None groups (BCN, and NCB) and how each
adaptation affected users’ performance with respect to time. The results are
shown in Graph 7:
Graph 7.
Overall time average for B, C, and N
The adaptation was
graphed as a function of its mean time value. In this case, 64 subjects account
for the data. Clearly, the Both adaptation
has reduced task completion time to slightly half that of None, and a
significant reduction compared to Color alone. The p-level in this analysis was
less than .0000001, making these results strongly significant.
Later we proceeded
to analyze the second major group, that of the Both-Layout-None adaptations
(BLN, and NLB). We analyzed how each adaptation affected users’ performance
with respect to time. The results were as follows:
Graph 8.
Overall time average for B, L, and N
Sixty four
subjects’ data was used in this case where the Both adaptation correlated with
a speedier task completion, being slightly twice as fast as Layout, and nearly
three times faster than None. The p-level here was less than .000006, again greatly significant.
After the two
groups were analyzed for time rankings, we proceeded to analyze the behavior of
the users in terms of number of clicks. Our first study was done on the B, C,
and N group.
Graph 9.
Overall average number of clicks for B, C, and N
In this case Both continued to be the strongest adaptation, yielding half
as many clicks compared to color, and nearly one third of the clicks in the
None case. These results had a strong p-level of .000001.
The same click analysis was conducted for the second group, B, L, and N
where we can clearly see that Both appeared with a reduced number of clicks
compared to Layout and None. The relationships remained constant, Both had a
reduced number of clicks compared to any of the other adaptations, and None
constantly performed worst. These results had a strong p-level of .000002.
Graph 10.
Overall average number of clicks for B, L, and N
As said earlier we also included “planned
comparisons analysis” between individual adaptations for each of the groups
(the B, C, and N group and the B, N, and L group), for both time and number of
clicks. This is important because the “one-way within-subjects analysis of
variance analysis” does not identify between which adaptations the significant
differences were, instead it only asserts the order (in this case between three
adaptations) with a given significance (the p-level as described in each case).
When analyzing the B, C, and N group we found
that Both took less time to complete, also totaling fewer clicks than any other
adaptation. Both was faster than Color with a significance of 0.00038. It was
strongly faster than None with a p-level of zero. When analyzing the number of
clicks Both performed above the rest, equally better than Color and None with
an amazing p-level of zero for both cases.
When the analysis was conducted for the B, L, and
N group, Both constantly performed better. Both was faster than Layout with a
p-level of 0.0017 while being better than None with a p-level of 0.00011. With
respect to clicks Both also performed appropriately above the rest, where it
took less clicks than Layout with a p-level of 0.00112, and fewer clicks than
None with a p-level of 0.00025.
In previous paragraphs we described
plan comparison analyses conducted with the Both adaptation related to None,
Color and Layout. The analysis was done
in this way because the experiments were set up in such a way that no single user
was exposed to both Color and Layout adaptation alone. It would have been inaccurate to analyze
these adaptations since the data used did not correspond to the same user. However, it can be seen in the graphs that
Color adaptation generated a more successful (reduce time and clicks) task
completion than Layout. However, this
might have been caused by the complexity of the tasks or the degree of
adaptation.
Another factor that could have affected the
results and/or analysis was the fact that our subject population was
concentrated on a very specific group.
In the following section we briefly explain the specific demographic
data that was submitted and its possible influence on the outcome of this
project.
As
mentioned previously in the design section, the users that conducted the
experiment were asked to fill a form (see Appendix D) with some personal
information. This information included
age, country of origin, Internet experience and knowledge of the Olympics. For privacy issues we decided not to
correlate or link the usernames and their demographic information (See Design
section). Not establishing this
relationship limited our possibilities of studying any of the effects that the
subject domain might have had on our analysis.
Some of the major trends in the information gathered about the users are
explained below.
The
users’ age was one of the fields that could not have affected the results and
analysis within this group because all of the subjects were in the range of 18
to 23 years old, and this was considered in the design process of the
experiment.
Another
piece of information that the users provided us with was their major. This field might have affected the results
and analysis since 73% of the subjects belonged to the Computer Science
department. We have assumed that this
segment of the population could have higher computer skills yielding a faster
task completion.
Acknowledging
the fact that the experiment was written in English, nationality
was taking into account for its possible effect in the time to complete each
task, as non-English speaking users might need a longer time to comprehend and
understand what the experiment is trying to communicate.
Internet
experience was another piece of information obtained from the users. This was measured in number of hours spent
weekly using the Internet and in how users rated themselves in this area. This trait could have affected the results
and/or analysis in the sense that expert users are more skilled in browsing
tasks. The data gathered revealed that
58% were intermediate users, 38% experts, and 3%
beginners.
Finally, they were asked about their
Olympics knowledge. Their degree of
knowledge was measured by asking them three basic questions: how interested
they were in the Olympics; how many times had they visited the official
Olympics Web site; and how they rated their knowledge in this area. Similarly to Internet experience, more
knowledgeable users in this field might have had an advantage, allowing them to
complete the tasks faster. Distribution
of this area ranged from 57% beginners, 30% intermediate, and 9%
expert users.
After
analyzing the statistical data and briefly describing any importance of the
demographic information, we now include a Conclusions section were we re-state,
argue, and prove our hypothesis, and describe the possible alternatives for
future work in this area.
Throughout
this report we have documented the details of the process we followed in order
to reach a conclusion to our hypothesis; this being that a Web site with color
and layout adaptations yields a more successful task completion. We initially described the methodology we
followed; continued with our experiment and system design, and finally,
displayed and explained results obtained after conducting the experiment. In
the previous section we have described the necessary statistical analysis
carried out on this data, and also including a demographic study of the
subjects. After finishing these phases we can say that our initial hypothesis
has been proven correct. We have included in this chapter necessary
argumentation in support of such a claim.
After analyzing
the data gathered we noticed that a significant amount supported our initial
statement that color and layout adaptations in Web sites will yield a more
successful task completion. First of
all, after conducting the analysis for each of the respective groups of users,
we discovered that when applying a single combination of color and layout
adaptations the user’s achieves their goal, faster: not only did time reflect a
decrease, but the number of mouse clicks were reduced as well. This was clear in both of the analyzed
groups: both adaptations together averaged less time and number of clicks
compared to single and none adaptations. This means that no matter how the
original Web site was shown, with or without adaptations, the users achieved
their task goals faster when adaptations were present, and an even higher
decrease when both, color and layout adaptations were combined.
Furthermore, when
color and layout variations where present by themselves as single adaptations,
reduced average times and number of clicks were apparent compared to when there
was no adaptation. Because of the order
in which the adaptations were presented (color adaptation was shown after both
adaptations were presented to users and layout adaptations after no
adaptations) we think that this might have been one of the causes for a smaller
time average for color than that for the layout. However, the difference between these two was about 8 seconds,
not greatly significant for the data gathered.
From our study,
changes in color or layout tend to be more effective when the previous task was
completed with no adaptation, since the variation in the interface is higher
than that of both adaptations, to color or layout adaptations. Another probable cause is that the subjects
are more receptive to color enhancement instead of layout. Something worth
mentioning is that the degree of variation for these two adaptations was not
known; they totally differed in context, hence we do not know whether these
changes were implemented to the “same” degree.
After completing
the data analysis we learned about the differences between layout and color
adaptations and their effect on the user’s task completion, in this case that
they significantly reduce time and clicks. We did not measure or compare the
effect differences between adaptations, since that was not the intent of our
study.
Now that we have
concluded our research, an interesting extension to our work would be to find a
controlled method of carrying out layout and color adaptations, and to study
how much each of these contribute to the total reduction of time and clicks.
This might be done by developing an experiment that answers questions like:
Compared to layout, how much did color adaptations contribute to the total
reduction of time and clicks? And vice versa. Continuing the adaptation topic,
studies with other adaptable elements (content, images, text, etc) could be
conducted to measure their effectiveness.
In addition, new metrics such as the degree of satisfaction could be
utilized to measure the effectiveness of such adaptations. A more complex study would develop a system
that implicitly gathers information from the user’s navigation; this
information would then aid the personalized adaptation of a given site.
Upon
completion of our MQP we have some final thoughts we wish to include. Not only
was this experience enriching as part of our capstone experience at WPI but it
also nurtured our already strong team skills: polished, often mentioned, and
highly praised at this institution. We had the opportunity to explore a less
often referred to area in the Computer Science field, which is the study of
human subjects and their relationships with a system’s interface. This venture
into a less orthodox field proved to us that there is much more to our choice
of study than to program senselessly into late hours of the night.
We
had the opportunity to work with two advisors,
quite the opposite of one another, who contributed to our experience
enormously. Their guidance was subtle yet encouraging, one that left us
confident and sure about our progress throughout the project. One of them
continuously dissected our every move and persistently made us stronger while
the other quite often showed unchallenged support, structured our system, and
focused strongly in the technical aspect. This combination proved to be perfect,
as we got from one what we lacked from the other. Their comments and
suggestions were seldom contradicting each other, making them easy to
understand and analyze.
ADWIZ. (1999). ADWIZ – Intelligent Advertisement
Targeting. <http://www.ccrl.com/adwiz/factsheet.html>
Browne, D. Totterdell, P. Norman, M. (1990). Adaptive
User Interfaces. London: Academic Press.
Brusilovsky, P. (1998). Methods and Techniques of
Adaptive Hypermedia. Netherlands: Kluwer Academic Publishers.
Carnegie Melon University. (2000). WebWatcher Project.
<http://www.cs.cmu.edu/~Webwatcher>
Durrett, H.J. (1987).
Color and the Computer. Orlando, FL: Academic Press, Inc.
Maybury, M. T. Wahlster, W. (1998). Reading in
Intelligent User Interfaces. San Francisco, CA: Morgan Kaufmann Publishers,
Inc.
Mobasher, B. Cooley, R. Srivastava, J. Creating Adaptive
Web Sites Through Usage- Based Clustering of URLs. <http://www.computer.org/proceedings/kdex/0453/04530019abs.htm>
Mullet, K. Sano, D. (1995). Designing Visual Interfaces:
Communication Oriented Techniques. Mountain View, CA: SunSoft Press.
Najjar, L. J. (1990).
Using color effectively (or peacocks can’t fly). Atlanta, GA: IBM
Corporation.
Nielsen, J. (1998). Testing whether Web Page Templates
are Helpful. <http://www.useit.com/alertbox/980517.html>
Perkowitz, M. Etzion, O. Adaptive Sites: Automatically
Learning from User Access Patterns. University of Washington.<http://www.scope.gmd.de/info/www6/posters/722/>
Perkowitz, M. (1999). Towards Adaptive Web Sites:
Conceptual Framework and Case Study. <http://www8.org/w8-papers/2b-customizing/towards/node1.html>
Shneiderman, B. (1998). Strategies for Effective
Human-Computer Interaction. Addison Wesley Longman, Inc.
Van Dam, A. Post-Wimp User Interfaces: The Human
Connection. <http://www.sensable.com/community/postwimp.htm>
Wright, P. Mosser-Wooley, D. Wooley, B. (2000) Techniques
& Tools for Using Color In Computer Interface Design. ACM Crossroads
Student Magazine. <http://www.acm.org/crossroads/xrds3-3/color.html>
WPI. (2000). WPI ADLN: Admission Requirements,
<http://www.wpi.edu/Academics/ADLN/admission.html>
Zinser, Otto. (1984). Basic Principles of Experimental
Psychology. New York, NY: McGraw-Hill.
In addition to the acknowledgement of our advisors, made
above, we would like to acknowledge:
Paula D. Quinn, from Clark University, who helped
us with our statistical analysis;
Dr. James K. Doyle, Associate Professor in the
Social Science & Policy Studies department at WPI, who helped us with the
experiment design; and
the many students who
acted as subjects for our experiment.
|
BOTH
|
COLOR
|
NONE
|
|
|
Answer
|
Time
|
Clicks
|
Answer
|
Time
|
Clicks
|
Answer
|
Time
|
Clicks
|
|
|
4
|
54
|
2
|
3
|
49
|
2
|
4
|
113
|
4
|
|
|
2
|
35
|
3
|
3
|
56
|
2
|
4
|
144
|
7
|
|
|
2
|
16
|
0
|
1
|
17
|
0
|
2
|
103
|
9
|
|
|
2
|
12
|
0
|
3
|
89
|
2
|
4
|
122
|
5
|
|
|
4
|
30
|
0
|
3
|
77
|
3
|
4
|
67
|
0
|
|
|
4
|
10
|
0
|
1
|
62
|
5
|
2
|
116
|
7
|
|
|
2
|
25
|
1
|
3
|
44
|
2
|
4
|
189
|
8
|
|
|
2
|
26
|
2
|
3
|
54
|
5
|
4
|
142
|
3
|
|
|
2
|
65
|
3
|
3
|
46
|
4
|
4
|
154
|
4
|
|
|
4
|
15
|
0
|
3
|
64
|
3
|
2
|
88
|
8
|
|
|
2
|
37
|
2
|
3
|
98
|
3
|
4
|
132
|
2
|
|
|
2
|
59
|
2
|
3
|
83
|
5
|
4
|
160
|
5
|
|
|
2
|
20
|
1
|
2
|
87
|
5
|
4
|
120
|
3
|
|
|
2
|
33
|
2
|
3
|
48
|
2
|
4
|
48
|
2
|
|
|
1
|
34
|
2
|
3
|
60
|
2
|
4
|
47
|
2
|
|
|
2
|
48
|
2
|
3
|
38
|
2
|
4
|
37
|
2
|
|
|
2
|
17
|
0
|
2
|
11
|
0
|
3
|
15
|
0
|
|
|
2
|
35
|
2
|
1
|
5
|
0
|
4
|
171
|
21
|
|
|
2
|
24
|
2
|
4
|
37
|
2
|
4
|
110
|
7
|
|
|
2
|
17
|
0
|
3
|
64
|
3
|
2
|
76
|
0
|
|
|
2
|
8
|
2
|
2
|
10
|
2
|
3
|
38
|
4
|
|
|
2
|
2
|
0
|
1
|
10
|
2
|
4
|
21
|
3
|
|
|
3
|
5
|
1
|
4
|
12
|
2
|
4
|
3
|
0
|
|
|
2
|
12
|
3
|
4
|
14
|
2
|
2
|
32
|
3
|
|
|
2
|
3
|
0
|
4
|
20
|
2
|
4
|
31
|
3
|
|
|
1
|
18
|
2
|
2
|
11
|
2
|
2
|
17
|
3
|
|
|
4
|
8
|
0
|
2
|
16
|
3
|
2
|
38
|
3
|
|
|
4
|
18
|
2
|
1
|
10
|
2
|
2
|
21
|
2
|
|
|
2
|
17
|
2
|
2
|
12
|
2
|
2
|
18
|
1
|
|
|
2
|
12
|
2
|
4
|
37
|
3
|
4
|
39
|
4
|
|
|
2
|
41
|
4
|
4
|
15
|
1
|
4
|
24
|
2
|
|
|
2
|
4
|
1
|
4
|
49
|
3
|
4
|
3
|
0
|
|
|
|
|
|
|
|
|
|
|
|
|
|
|
23.8
|
1.406
|
|
40.8
|
2.438
|
|
76.2
|
3.969
|
Average Values
|
|
|
|
|
|
|
|
|
|
|
|
|
9
|
|
|
15
|
|
|
11
|
|
|
Wrong Answers
|
Table A1: Both, Color, and None
|
BOTH
|
LAYOUT
|
NONE
|
|
|
Answer
|
Time
|
Clicks
|
Answer
|
Time
|
Clicks
|
Answer
|
Time
|
Clicks
|
|
|
3
|
22
|
0
|
3
|
45
|
2
|
4
|
51
|
5
|
|
|
3
|
44
|
2
|
3
|
54
|
3
|
4
|
264
|
27
|
|
|
2
|
19
|
2
|
2
|
21
|
2
|
2
|
23
|
13
|
|
|
3
|
42
|
2
|
4
|
99
|
20
|
4
|
62
|
2
|
|
|
3
|
21
|
1
|
4
|
54
|
2
|
4
|
36
|
2
|
|
|
3
|
32
|
1
|
3
|
40
|
2
|
4
|
53
|
3
|
|
|
3
|
19
|
2
|
3
|
51
|
4
|
4
|
158
|
14
|
|
|
3
|
34
|
2
|
3
|
37
|
2
|
2
|
192
|
11
|
|
|
3
|
32
|
5
|
3
|
130
|
11
|
4
|
134
|
2
|
|
|
3
|
20
|
2
|
3
|
51
|
2
|
4
|
54
|
2
|
|
|
2
|
32
|
0
|
2
|
18
|
2
|
2
|
188
|
16
|
|
|
3
|
87
|
8
|
4
|
65
|
2
|
4
|
45
|
2
|
|
|
3
|
26
|
2
|
3
|
41
|
2
|
2
|
48
|
2
|
|
|
3
|
22
|
2
|
3
|
35
|
3
|
4
|
98
|
0
|
|
|
3
|
42
|
2
|
2
|
177
|
17
|
4
|
98
|
4
|
|
|
2
|
6
|
2
|
2
|
8
|
2
|
2
|
8
|
12
|
|
|
4
|
10
|
2
|
1
|
121
|
12
|
4
|
78
|
32
|
|
|
3
|
17
|
2
|
1
|
13
|
0
|
4
|
30
|
2
|
|
|
3
|
43
|
1
|
4
|
181
|
4
|
4
|
271
|
4
|
|
|
3
|
91
|
2
|
3
|
78
|
3
|
4
|
117
|
3
|
|
|
2
|
18
|
0
|
4
|
18
|
2
|
2
|
51
|
2
|
|
|
4
|
49
|
2
|
3
|
58
|
3
|
4
|
148
|
7
|
|
|
3
|
32
|
6
|
3
|
49
|
2
|
4
|
217
|
11
|
|
|
2
|
14
|
0
|
3
|
406
|
2
|
4
|
515
|
2
|
|
|
3
|
6
|
2
|
3
|
68
|
4
|
4
|
38
|
4
|
|
|
3
|
8
|
2
|
2
|
6
|
2
|
2
|
17
|
2
|
|
|
3
|
2
|
2
|
4
|
5
|
2
|
4
|
41
|
3
|
|
|
3
|
2
|
0
|
4
|
3
|
2
|
3
|
10
|
2
|
|
|
3
|
49
|
3
|
2
|
56
|
4
|
2
|
38
|
3
|
|
|
1
|
29
|
3
|
2
|
10
|
2
|
2
|
12
|
1
|
|
|
3
|
3
|
0
|
3
|
47
|
4
|
4
|
40
|
3
|
|
|
3
|
14
|
2
|
2
|
28
|
2
|
4
|
15
|
0
|
|
|
3
|
3
|
0
|
3
|
35
|
2
|
4
|
25
|
3
|
|
|
3
|
19
|
2
|
4
|
17
|
2
|
4
|
26
|
3
|
|
|
3
|
9
|
2
|
2
|
10
|
2
|
4
|
12
|
2
|
|
|
|
|
|
|
|
|
|
|
|
|
|
|
26.2
|
1.943
|
|
61
|
3.829
|
|
91.8
|
5.886
|
Average Values
|
|
|
|
|
|
|
|
|
|
|
|
|
8
|
|
|
19
|
|
|
10
|
|
|
Wrong Answers
|
Table A2: Both, Layout, and None
|
NONE
|
COLOR
|
BOTH
|
|
|
Answer
|
Time
|
Clicks
|
Answer
|
Time
|
Clicks
|
Answer
|
Time
|
Clicks
|
|
|
2
|
30
|
4
|
3
|
23
|
2
|
4
|
34
|
2
|
|
|
2
|
220
|
6
|
3
|
117
|
5
|
4
|
37
|
1
|
|
|
2
|
50
|
4
|
3
|
11
|
2
|
4
|
40
|
0
|
|
|
2
|
52
|
3
|
3
|
43
|
2
|
4
|
18
|
1
|
|
|
2
|
271
|
2
|
4
|
57
|
3
|
4
|
18
|
0
|
|
|
3
|
21
|
0
|
1
|
7
|
0
|
1
|
2
|
0
|
|
|
2
|
75
|
4
|
3
|
32
|
5
|
4
|
9
|
0
|
|
|
2
|
38
|
2
|
3
|
35
|
2
|
4
|
40
|
0
|
|
|
2
|
94
|
3
|
3
|
23
|
3
|
4
|
18
|
1
|
|
|
2
|
79
|
2
|
3
|
29
|
2
|
4
|
38
|
2
|
|
|
2
|
95
|
4
|
3
|
57
|
2
|
4
|
71
|
2
|
|
|
2
|
49
|
2
|
3
|
41
|
2
|
4
|
25
|
2
|
|
|
2
|
81
|
4
|
3
|
75
|
3
|
4
|
9
|
0
|
|
|
2
|
78
|
2
|
3
|
34
|
2
|
4
|
14
|
1
|
|
|
2
|
77
|
4
|
4
|
33
|
3
|
4
|
6
|
0
|
|
|
2
|
39
|
2
|
3
|
26
|
2
|
4
|
19
|
1
|
|
|
2
|
85
|
4
|
3
|
31
|
3
|
4
|
124
|
2
|
|
|
2
|
61
|
3
|
3
|
53
|
2
|
4
|
8
|
0
|
|
|
2
|
96
|
2
|
4
|
44
|
5
|
4
|
7
|
0
|
|
|
2
|
42
|
2
|
3
|
47
|
2
|
4
|
12
|
0
|
|
|
2
|
41
|
4
|
3
|
8
|
0
|
4
|
9
|
1
|
|
|
3
|
34
|
0
|
3
|
4
|
0
|
4
|
6
|
0
|
|
|
2
|
2
|
0
|
3
|
2
|
0
|
4
|
7
|
0
|
|
|
2
|
40
|
2
|
4
|
47
|
2
|
4
|
15
|
1
|
|
|
2
|
51
|
3
|
2
|
44
|
2
|
4
|
7
|
0
|
|
|
2
|
33
|
2
|
3
|
51
|
3
|
4
|
47
|
3
|
|
|
2
|
26
|
4
|
3
|
46
|
2
|
4
|
42
|
2
|
|
|
2
|
29
|
2
|
3
|
56
|
2
|
4
|
34
|
0
|
|
|
2
|
4
|
0
|
3
|
3
|
0
|
4
|
24
|
0
|
|
|
2
|
30
|
2
|
3
|
49
|
2
|
4
|
14
|
1
|
|
|
2
|
3
|
0
|
3
|
4
|
0
|
4
|
4
|
0
|
|
|
1
|
4
|
0
|
3
|
4
|
0
|
4
|
35
|
0
|
|
|
|
|
|
|
|
|
|
|
|
|
|
|
60.3
|
2.438
|
|
35.5
|
2.031
|
|
24.8
|
0.719
|
Average Values
|
|
|
|
|
|
|
|
|
|
|
|
|
3
|
|
|
6
|
|
|
1
|
|
|
Wrong answers
|
|
NONE
|
LAYOUT
|
BOTH
|
|
|
Answer
|
Time
|
Clicks
|
Answer
|
Time
|
Clicks
|
Answer
|
Time
|
Clicks
|
|
|
2
|
47
|
7
|
4
|
24
|
0
|
4
|
23
|
1
|
|
|
2
|
75
|
2
|
4
|
73
|
2
|
4
|
58
|
0
|
|
|
2
|
24
|
3
|
3
|
44
|
2
|
4
|
14
|
0
|
|
|
2
|
18
|
2
|
3
|
32
|
3
|
4
|
16
|
1
|
|
|
2
|
90
|
3
|
3
|
48
|
2
|
4
|
35
|
0
|
|
|
3
|
7
|
0
|
3
|
7
|
0
|
4
|
6
|
0
|
|
|
3
|
10
|
3
|
3
|
10
|
0
|
3
|
3
|
0
|
|
|
2
|
27
|
2
|
3
|
32
|
2
|
4
|
22
|
0
|
|
|
2
|
107
|
2
|
4
|
74
|
0
|
4
|
40
|
2
|
|
|
2
|
57
|
2
|
3
|
55
|
3
|
4
|
19
|
1
|
|
|
2
|
37
|
2
|
3
|
37
|
2
|
4
|
19
|
1
|
|
|
2
|
58
|
3
|
2
|
33
|
2
|
4
|
32
|
2
|
|
|
1
|
8
|
0
|
2
|
10
|
0
|
4
|
9
|
0
|
|
|
2
|
57
|
2
|
3
|
76
|
3
|
4
|
22
|
0
|
|
|
2
|
40
|
2
|
3
|
54
|
5
|
4
|
7
|
0
|
|
|
2
|
19
|
2
|
2
|
8
|
2
|
2
|
11
|
0
|
|
|
2
|
11
|
2
|
3
|
16
|
3
|
4
|
28
|
4
|
|
|
2
|
14
|
0
|
3
|
10
|
2
|
4
|
24
|
1
|
|
|
2
|
40
|
3
|
3
|
4
|
0
|
4
|
5
|
0
|
|
|
2
|
14
|
2
|
3
|
5
|
0
|
4
|
26
|
1
|
|
|
2
|
18
|
2
|
3
|
5
|
0
|
1
|
3
|
0
|
|
|
2
|
11
|
0
|
3
|
69
|
4
|
4
|
35
|
1
|
|
|
3
|
13
|
3
|
2
|
10
|
2
|
4
|
8
|
0
|
|
|
4
|
12
|
0
|
2
|
7
|
0
|
4
|
4
|
0
|
|
|
2
|
21
|
3
|
2
|
19
|
2
|
4
|
30
|
3
|
|
|
2
|
10
|
2
|
3
|
46
|
3
|
4
|
25
|
1
|
|
|
2
|
17
|
2
|
2
|
2
|
2
|
2
|
3
|
0
|
|
|
2
|
10
|
2
|
3
|
2
|
2
|
4
|
4
|
2
|
|
|
2
|
19
|
2
|
3
|
4
|
2
|
4
|
2
|
0
|
|
|
|
|
|
|
|
|
|
|
|
|
|
|
30.7
|
2.069
|
|
28.1
|
1.724
|
|
18.4
|
0.724
|
Average Values
|
|
|
|
|
|
|
|
|
|
|
|
|
5
|
|
|
9
|
|
|
4
|
|
|
Wrong answers
|
Table A4: None, Layout, and Both
#!/usr/local/bin/perl -w
use CGI qw/:standard/;
#=====================================================================
# Esteban Burbano eburban@wpi.edu
# Joel Minski jminski@wpi.edu
#
# Major Qualifying Project -
Adaptive Web Sites
# Date: November 2000
#
# experiment.cgi
#
# This program generates the
frames for the experiment to be taken.
# It uses the experiment
cookie in order to find out which url should
# be used in the bottom
frame.
#
#=====================================================================
# Variables
my %experiment_info; # hash used to read from the
experiment cookie
my $url; # holds the url for the lower frame
# get cookie information
%experiment_info =
cookie('experiment');
# join the strings from the
appropriate directory and the file index.html to produce the desired url
$url = join "/",
$experiment_info{"url"}, "index.html";
print "Content-type:
text/html\n\n";
print
"<html>\n";
print
"<head>\n";
print
"</head>\n";
print "<frameset
rows=\"130,*\" border=\"10\">\n";
print "<FRAME title=\"Questions\"
MARGINWIDTH=\"0\" MARGINHEIGHT=\"0\"
SCROLLING=\"no\" NAME=\"Question\"
SRC=\"../form.html\">\n";
print "<FRAME
NAME=\"Contents\" SRC=\"../$url\"
TITLE=\"Contents\">\n";
print
"</frameset>\n";
print
"</html>\n";
#!/usr/local/bin/perl -w
use CGI qw/:standard/;
use Fcntl
":flock";
#=====================================================================
# Esteban Burbano eburban@wpi.edu
# Joel Minski jminski@wpi.edu
#
# Major Qualifying Project -
Adaptive Web Sites
# Date: November 2000
#
# questions.cgi
#
# This program implements an
experiment to test the effects of layout
# and color on adaptive Web
sites. This program generates dynamically
# the questions and answers
for the experiment and it gathers results
# from each of the users.
The data gathered are the answers to each of
# the questions and the time
taken to complete the task.
#
#=====================================================================
# Variables
my $question_file; # holds the filename that
# contains the questions and
# answers
my $results_file; # holds the filename that
# contains the results
my $files_extension =
".txt"; # holds the
extensions of all the
# files to be used
my %values; # stores the values
passed by the
# form in the html
my %user_info; # hash used to get
information
# from the cookie and to store
# information
# to the cookie. This
information
# is the one from the question
# cookie.
my %time_info; # hash used to get
information
# from the cookie and to store
# information
# to the cookie. This
information
# is the one from the time
# cookie.
my %experiment_info; # hash used to get
information
#
from the cookie and to store
#
information
#
to the cookie. This information
#
is the one from the experiment
#
cookie
my %clicks; # hash used to get
information
# from the cookie and to store
# information
#
to the cookie. This information # is the one from the counter
#
cookie.
my $q = new CGI; # created a new CGI
object
my $question; # this variable will
hold the
# question to be displayed
my @answers; # this array will
hold the
# answers to be displayed
my $question_number; # the current question
number
my $myCookie; # answers cookie
my $myOtherCookie; # time cookie
my $anotherCookie; # counter cookie
# get the parameters passed
by the previous form
foreach $name ($q->param)
{
$values{$name} = $q->param($name);
}
# collect the information
form the cookies into their appropriate
# hashes
&initialize;
# is this the first time the
script is running?
if
($values{"previous"} eq "0") {
$question_number = $values{"previous"};
}
# it is not the first time
else {
$question_number = $user_info{"previous"};
}
# get the information from
the cookie that counts the number of clicks
&clicks;
# if the user has completed
the last question we want to write the
# information into the file
and redirect
# him/her to a thank you
page
if ($question_number == 3) {
&print_thanks;
&print_user_input_file;
# print user input into the file
}
# the user is still
experimenting
else {
&parse_question; #
get next question from the file
&time_it; #
how long does it take the user to complete the task
&print_form; #
print next form
# &print_html;
}
#======================================================================
# parse_question()
#
# This function gets the
question and answers that should be displayed
# next and stores them into
their appropriate variables ($question and
# @answers).
# The format of the file
that holds the questions is:
#
# QUESTION
# ANSWER 1
# ANSWER 2
# ANSWER 3
# ANSWER 4
#
# and it holds the questions
for one group of users.
# As it can be seen, we are
using the flock function in order to
# provide
# access security
#======================================================================
sub parse_question {
# open file
open (QUES, "<$question_file") or die
"$question_file: No such file";
# provide reading restriction to others that want to do so
flock QUES, LOCK_SH;
# parse the appropriate question using the question number
variable
for ($i=0; $i<$question_number+1; $i++) {
$question = <QUES>;
chomp $question;
# parse the answers to the question
for ($j=0; $j<4; $j++) {
$answers[$j] =
<QUES>;
chomp $answers[$j];
}
}
# unlock the file for reading
flock QUES, LOCK_UN;
# close file
close (QUES);
}
#======================================================================
# print_form()
#
# This function prints the
form dynamically depending on the
# appropriate
# information to be
displayed.
# The first thing that this
function does is write the question cookie.
#======================================================================
sub print_form {
# write question cookie
&write_cookie;
# print form
print $q->header("text/html", -cookie => $myCookie);
print "<center>";
print $q->start_html( -title => "Question",
-background => "../Images/background.gif"),
$q->start_form,
$q->h2("Question ", $question_number+1,
"- ", $question);
print "<font size=+1>";
print
$q->radio_group(-name => $question_number,
-values
=> ["1", "2", "3", "4"],
-labels
=> { 1 => $answers[0], 2 => $answers[1], 3 => $answers[2], 4 =>
$answers[3]}
);
print "</font><br><br>";
print $q->submit(-value => "Submit"),
$q->end_form,
$q->end_html;
print "</center>";
}
#======================================================================
# print_html()
#
# This function is for
debugging purposes, it is used to display the
# information that the
question cookie holds in order to check if the
# process was done well.
#======================================================================
sub print_html {
print $q->start_html( -title => "Test CGI");
foreach $name (keys %user_info) {
print
$q->h1($name),
$q->h2($user_info{$name});
}
print $q->end_html;
}
#======================================================================
# print_user_input_file()
#
# This function generates
the file that holsd the results from each
# each user. It holds the
answer to each question, the time it took the
# user to enter the answer
and finally it holds the number of clicks
# done by the user in order
to get to the page that contained the
# answer.
#
# The format of the file is
the following:
#
# ANSWER1, TIME1, CLICKS1,
ANSWER2, TIME2, CLICKS2, ANSWER3, TIME4,
# CLICKS3
#
# The reason behind the
format of the file is that it could be parsed
# by
# excel and probably most of
the programs that will be used to analyze
# the results. This format
could be easily changed.
#
# Again, the flock function
is used in order to block other writting
# from two different users
at the same time. In this way the results
# will be written correctly.
#
#======================================================================
sub print_user_input_file {
my $last_time = ($sec+($min*60)+($hour*3600))-$time_info{3};
open (RESULTS, ">>$results_file") or die
"$results_file: no such file";
flock RESULTS, LOCK_EX;
print RESULTS
"$user_info{0},$time_info{1},$clicks{1},$user_info{1},$time_info{2},$clicks{2},$user_info{2},$last_time,$clicks{3}\n";
flock RESULTS, LOCK_UN;
close (RESULTS);
}
#======================================================================
# print_thanks()
#
# This function generates a
thank you page after the user has finished
# the expreiment.
#
#======================================================================
sub print_thanks {
print $q->header("text/html"),
$q->start_html(-title => "Thank you very much",
-background => "../Images/background.gif"),
$q->h2("Thank you!"),
$q->p("Thank you very much for participating, you
username has
been recorded and will be
sent to your professor for extra credit. Please
close this window to finish
experiment"),
$q->end_html;
}
#======================================================================
# initialize()
#
# This function initializes
the information of each of the hashes. The
# hashes contain the
information from the questions cookie and from the
# time cookie. This is done
in order for it to be used.
#
# The time is also
calculated here in order to calculate the experiment
# time.
#
#======================================================================
sub initialize {
# get cookie information from the questions cookie
%user_info = cookie('questions');
# get the information that came from the form before the
current
foreach $key (keys %values) {
$user_info{$key} = $values{$key};
}
# get the local time from the user's computer
($sec,$min,$hour,$mday,$mon,$year,$wday,$yday,$isdst) =
localtime(time);
# get cookie information from the time cookie
%time_info = cookie('time');
# get cookie information from the experiment cookie
%experiment_info = cookie('experiment');
# get cookie information from the experiment cookie
%clicks = cookie('counter');
# set the correct filenames for each the questions and the
results by joining strings with group number
$question_file = join $experiment_info{"group"},
"questions", $files_extension;
$results_file = join $experiment_info{"group"},
"../Data/results", $files_extension;
}
#======================================================================
# write_cookie()
#
# This function generated
the questions cookie.
#
#======================================================================
sub write_cookie {
# update the previous field that is going to be stored in the
# cookie
$user_info{"previous"} = $question_number+1;
# generate questions cookie
$myCookie = cookie (-NAME=>"questions",
-VALUE=>\%user_info,
-DOMAIN=>"www.wpi.edu",
-PATH=>"/~jminski/MQP/cgi-bin/", -EXPIRES=>"+1h");
}
#======================================================================
# time_it()
#
# This function calculates
the time that it took the user to answer the
# question (to complete the
task).
# This time is calculated by
getting the local time at the beginning of
# each of the tasks and they
are substracted in order to determine the
# completion time.
# The time is stored in
seconds only.
#======================================================================
sub time_it {
# if this is the first time the program is running
if (!(keys %time_info)) {
$time_info{"number"} = 1;
}
else {
$time_info{"number"}++;
}
# store the time in the hash in seconds
$time_info{$time_info{"number"}} = $sec+($min*60)+($hour*3600);
# if applicable, calculate the time difference and store it in
the
# hash
if ($time_info{"number"} > 1) {
$time_info{$time_info{"number"}-1} =
$time_info{$time_info{"number"}} -
$time_info{$time_info{"number"}-1};
}
# generate time cookie
$myOtherCookie = cookie (-NAME=>"time",
-VALUE=>\%time_info,
-DOMAIN=>"www.wpi.edu",
-PATH=>"/~jminski/MQP/cgi-bin/",
-EXPIRES=>"+1h");
# send it to the client browser
print "Set-Cookie: $myOtherCookie";
}
#======================================================================
# clicks()
#
# This function gets the
information from the counter cookie and gets
# the clicks done by the
user in some task. After the clicks are stored
# in a local hash table, the
cookie is then writen again and the number
# of clicks in the cookie is
set to 0 again.
#======================================================================
sub clicks {
# get the clicks done by the user
$clicks{$question_number} = $clicks{"count"};
# set the number of clicks to 0
$clicks{"count"} = 0;
# generate clicks cookie
$anotherCookie = cookie (-NAME=>"counter",
-VALUE=>\%clicks,
-DOMAIN=>"www.wpi.edu",
-PATH=>"/~jminski/MQP/cgi-bin/",
-EXPIRES=>"+1h");
print "Set-Cookie: $anotherCookie\n";
}
#!/usr/local/bin/perl -w
use CGI qw/:standard/;
use Fcntl
":flock";
#=====================================================================
# Esteban Burbano eburban@wpi.edu
# Joel Minski jminski@wpi.edu
#
# Major Qualifying Project -
Adaptive Web Sites
# Date: November 2000
#
# direct.cgi
#
# This program is invoked
when the user submits the information from
# the user_information form.
This program stores all the information
# entered by the user in
their appropriate files. The usernames are
# stores together and by
themselves and the rest of the information
# is stored in another file.
After all the information is entered into
# the files this program
generates a random number and directs the
# user to their appropriate
experiment group by storing the group
# number and group URL into
an experiment cookie
#
#=====================================================================
# Variables
my $q = new CGI; # created a new CGI
object named
my $extension =
".txt"; # file
extension for user
# information
my $user_information_file =
"../Data/user_information"; #
holds the
# general filename for the user
# information
my $user_names_file =
"../Data/usernames.txt"; #
holds the filename
# for the usernames
my $information_file; # final user information file
# with group number
my %values; # hash used to get
information
#passed by the user_information
# form
my $experiment_number; # holds the experiment number
# that the user is going to be
# directed to
my %question_info; # hash used to write the
# appropriate information to the
# experiment cookie
my $myCookie; # experiment cookie
# generate a random integer
between 1 and 4
$experiment_number =
int(rand 4) + 1;
# set the correct filename
for the user information to be stored
$information_file = join
$experiment_number, $user_information_file, $extension;
# open user information file
open (INFO,
">>$information_file") or die "$information_file: no such
file";
# open usernames file
open (USER,
">>$user_names_file") or die "$user_names_file: no such
file";
# lock both files for
reading
flock USER, LOCK_EX;
flock INFO, LOCK_EX;
# get the parameters passed
by the previous form
foreach $name ($q->param)
{
$values{$name} = $q->param($name);
}
# print information into
both the user information and usernames file
foreach $name (keys %values)
{
if ($name ne "login") {
print INFO "$name: $values{$name}\n";
}
else {
print USER "$values{$name}\n";
}
}
# write cookie
&write_cookie;
# redirect to the cgi
program that will generate the frames for the
# experiment
print "Location:
experiment.cgi\n\n";
# unlock reading permissions
flock INFO, LOCK_UN;
flock USER, LOCK_UN;
# close file
close (USER);
#======================================================================
# write_cookie()
#
# This function generated
the experiment cookie.
#
#======================================================================
sub write_cookie {
# store the group number for that user
$question_info{"group"} = $experiment_number;
# store the appropriate url depending on the experiment_number
generated randomly
if ($experiment_number == 1) {
$question_info{"url"} = "BCN";
}
elsif ($experiment_number == 2) {
$question_info{"url"} = "BLN";
}
elsif ($experiment_number == 3) {
$question_info{"url"} = "NCB";
}
elsif ($experiment_number == 4) {
$question_info{"url"} = "NLB";
}
# generate cookie
$myCookie = cookie (-NAME=>"experiment",
-VALUE=>\%question_info,
-DOMAIN=>"www.wpi.edu",
-PATH=>"/~jminski/MQP/cgi-bin/",
-EXPIRES=>"+1h");
print "Set-Cookie: $myCookie\n";
}
#!/usr/local/bin/perl -w
use CGI qw/:standard/;
#=====================================================================
# Esteban Burbano eburban@wpi.edu
# Joel Minski jminski@wpi.edu
#
# Major Qualifying Project -
Adaptive Web Sites
# Date: November 2000
#
# counter.cgi
#
# This program counts the
number of clicks that are done in the Web
# site. This program is
invoked whenever a link is clicked in the Web
# site. Basically, what it
does is that it maintains a cookie that
# holds a counter with the
number of clicks until that instant. The
# questions.cgi program
accesses this cookie in order to take the
# number of clicks and
display them in the results file.
#
#=====================================================================
# Variables
my $myCookie; # counter cookie
my $url =
$ENV{QUERY_STRING}; # parses the
query string of the URL (http://path?query_string)
my %user_info; # hash used to get th
information
# from the cookie and to store
# to the cookie. This
information
# is the one from the conter
# cookie
# get cookie information
%user_info =
cookie('counter');
# if this is the first time
the user clicks on a link
if (!(keys %user_info))
{
$user_info{"count"} = 1;
}
else { # if not the first
time
$user_info{"count"}++;
}
# generate cookie
$myCookie = cookie
(-NAME=>"counter", -VALUE=>\%user_info,
-DOMAIN=>"www.wpi.edu",
-PATH=>"/~jminski/MQP/cgi-bin/",
-EXPIRES=>"+1h");
print "Set-Cookie:
$myCookie\n";
# redirect the user to the
appropriate URL given by the query string
print "Location:
../$url\n\n";
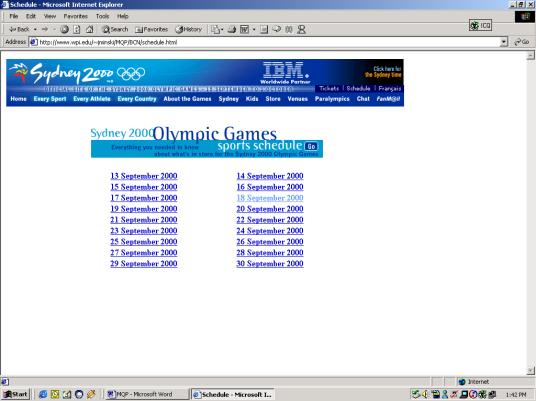
Both adaptations
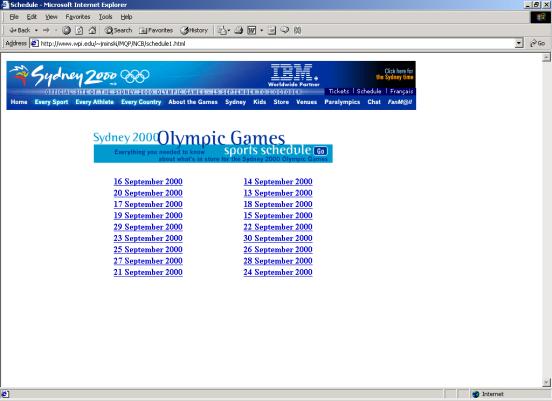
No Adaptation
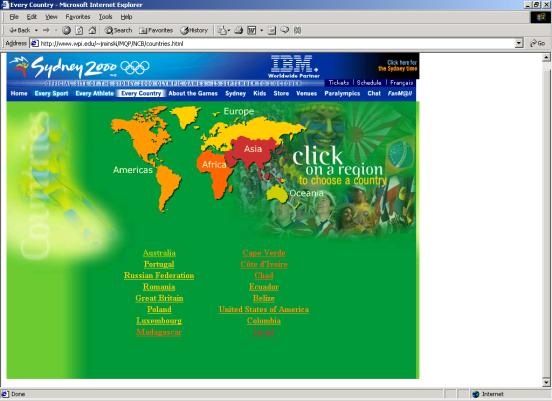
Both Adaptations

No Adaptation
No Adaptation
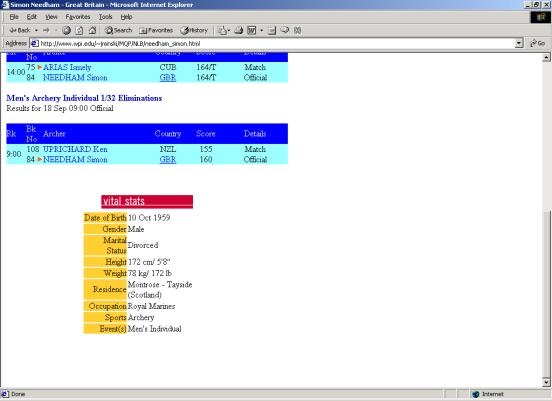
No Adaptation
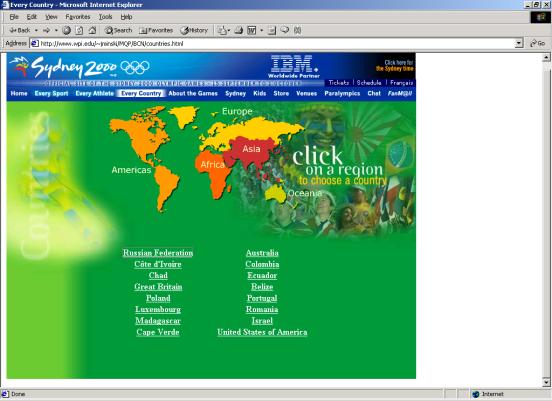
No Adaptation
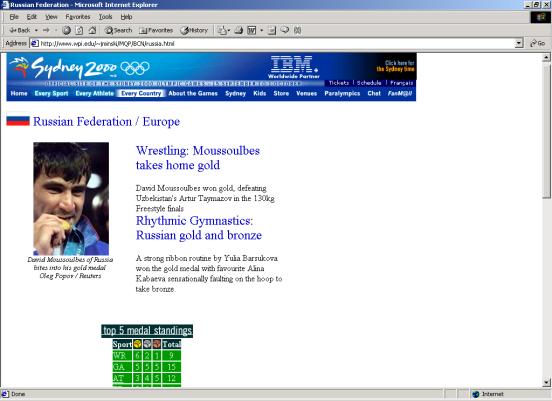
No Adaptation
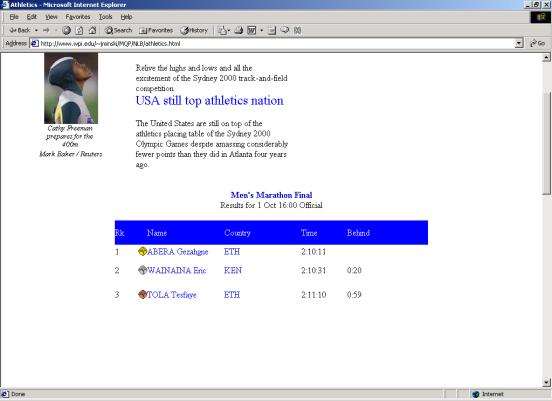
Layout Adaptation
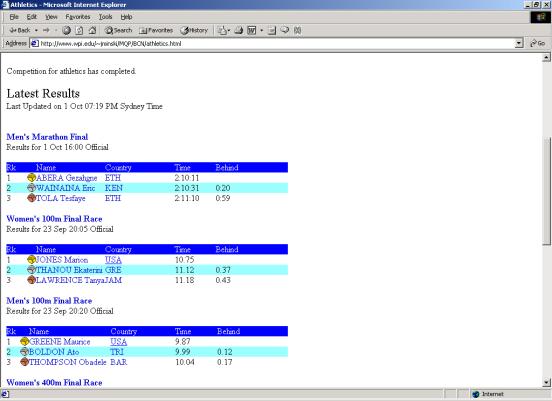
No Adaptation
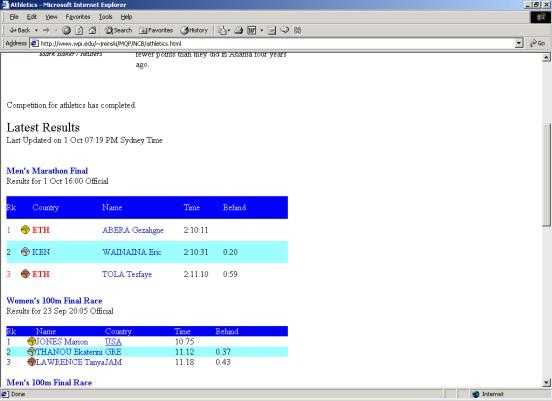
Color Adaptation
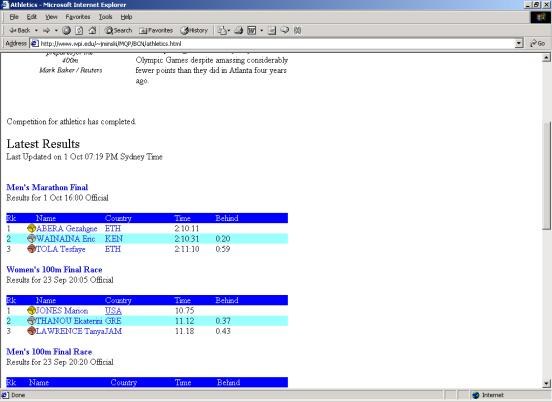
No Adaptation