Problem 2. Data Integration, OLAP and Multidimensional Analysis (20 points)
1. (8 points) Compare the data warehouse and the mediation approaches to data integration. Discuss the similarities and differences between the architectures of the two approaches.
Both data warehousing and data mediation are forms of data integration over multiple sources. The primary difference is that a data warehouse acts as a materialized view rather than a dynamic view like data mediation.
Both sources can answer the same queries, however there are tradeoffs to using each. A data warehouse tends to be faster since the view is materialized before the query is run. Mediation on the other hand provides up to date information because the view is not evaluated until runtime, which is why mediation is slower.
Data warehousing requires additional equipment such as a server with a DBMS. Most of this can be bought off the shelf. Mediation on the other hand needs specific programs tailored to the data to act as mediators and wrappers.
2. Consider the following relational table:
|
Model |
Year |
Color |
Sales |
|
Chevy |
1990 |
red |
5 |
|
Chevy |
1990 |
white |
87 |
|
Chevy |
1990 |
blue |
62 |
|
Chevy |
1991 |
red |
54 |
|
Chevy |
1991 |
white |
95 |
|
Chevy |
1991 |
blue |
49 |
|
Chevy |
1992 |
red |
31 |
|
Chevy |
1992 |
white |
54 |
|
Chevy |
1992 |
blue |
71 |
|
Ford |
1990 |
red |
64 |
|
Ford |
1990 |
white |
62 |
|
Ford |
1990 |
blue |
63 |
|
Ford |
1991 |
red |
52 |
|
Ford |
1991 |
white |
9 |
|
Ford |
1991 |
blue |
55 |
|
Ford |
1992 |
red |
27 |
|
Ford |
1992 |
white |
62 |
|
Ford |
1992 |
blue |
39 |
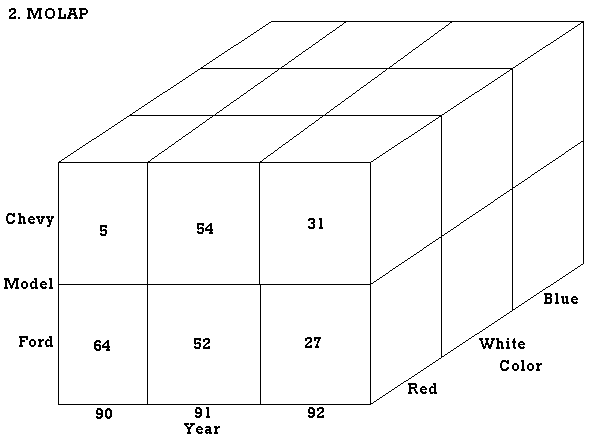
(a) (4 points) Show how the data in the relational table above can be represented in a multidimensional (MOLAP) database.

(b) (8 points) Using the data above explain how the pivoting, roll-up, drill-down, and slice-and-dice operations work.
Pivoting, rollup, drill-down, and slice-and-dice refer to front end query applications of OLAP. The focus of these applications is to compute data
relationships for one or more dimensions of the data by consolidating/aggregating data of interest to the user. A brief summary of these front end applications related to the above database is given below.
Pivoting - Pivoting operation is to select 2 (or more) dimensions of the data to aggregate a particular measure(s) of interest. For the above rational database, an example of pivoting is to view (obtain) all sales of cars that are Model-Chevy, Year-1990 and Color-red. Hence, total sales of 5 would be returned in this example. Sales information about all other years, models, and colors is omitted in this search.
Roll-up - Roll-up operation is to further increase the level of aggregation of the data, perhaps to focus on a single dimension. An example of roll-up using the above data is to view (obtain) all sales of cars that are Model-Chevy. This would return a total of 508 sales of Model-Chevy (irrespective of year and color). Sales information on all other models, years and colors in the database is omitted in this query.
Drill-Down - Drill-down operation is an inverse operation to roll-up, i.e. to decrease the level of aggregation of the data. For the above relational data, we can use drill-down to determine the total sales for each color of a particular car model. For example, given the sales of Model-Chevy, drill-down to obtain sales of all Color-red Chevys. Another example of drill-down for a different dimension is given sales by Model-Chevy, return the sales for a particular year.
Slice-and-Dice - Slice and Dice operation reduces the dimensionality of the data by taking a projection of the data on a subset of dimension for selected values of another dimension. For example, given the total sales by Model, we can slice-and-dice to determine a subset of the sales of a particular color model for a particular year. Using the above data, we can view (obtain) sales for Model-Chevy, Year-1991. This would return 198 sales. Another dimensional view using slice-and-dice is to return all sales of Color-red cars. This would return 233. Given the dimensionality of the above relational datd base, slice-and-dice is similar to pivoting.