Program Planning
Yesterday, we looked at a couple of different solutions for the Rainfall and MaxTripleLength problems from the last homework. The solutions differed in which sets of tasks they performed together; different task configurations can lead to different numbers of traversals over the data. How you configure tasks results in tradeoffs between efficiency, readability, maintability, and other concerns in program design.
Yesterday, we also introduced two principles you could consider when designing a program: from Rainfall, we saw the idea of cleaning the data to simplify later tasks; from MaxTripleLength, we saw the idea of reformatting or parsing the data into a different shape that made part of the problem easier to implement.
These are two possible principles that you can consider when given a set of data to process. They aren’t the only ones, but they are two common ones. When you look at a new programming problem, it can sometimes help to ask whether any of these principles will help you get to a solution.
But what if you still don’t see how to get started, or what if you forget the principles? Another thing you can try is to work with examples and test cases to help you try to simplify the problem to a series of concrete steps that you can solve.
Let’s illustrate the idea on Rainfall, then try a couple of other problems.
1 An Example of Program Planning: Rainfall
We already strongly recommend that you write out examples and test cases before you start writing code. The idea is to make sure you understand what the question is asking you to do. If we did that with Rainfall, we might write something like
Rainfall([1,2,3]) should produce 2 |
Rainfall([1,2,-3,3,-999]) should produce 2 |
(note that I’m using a shorthand here for readability, rather than write these out fully in code. You may find it useful to write shorthand examples out on paper, as building examples can feel unwieldly in Java.)
These examples focus on the output, but they don’t help you break the problem into its separate tasks. So instead, let’s take a slightly larger example and use it to figure out the tasks of the problem. We’ll start by writing down just the input list (not the expected answer).
Rainfall([1, 2, -3, 4, -5, -6, 7, 8, -999, 10 , 11]) |
Now, ask yourself whether a different version of this data seems easier, or more useful, for this computation. By different version, I mean do you need only some of the data, could you put it in a different format, could you swap it around to put relevant data closer together, etc. The Rainfall problem statement says to ignore negatives and all data after -999. So the data we actually care about it:
Rainfall([1, 2, 4, 7, 8]) |
Let’s draw a diagram to summarize what we know so far. The dashed "hole" captures details that we have to fill in:
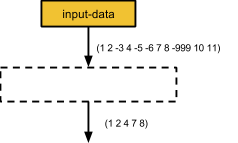
So the first question is, how do you get from the original input to this better/more useful data? What operations did you perform? Here, we did two:
We removed all the negatives
We truncated the list starting from -999
Each of these tasks can become a separate function. Pick descriptive names for them:
We removed all the negatives: remove-negatives
We truncated the list starting from -999: truncate-sentinel
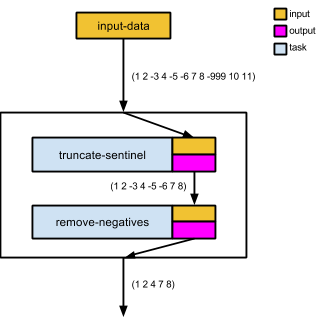
Now, ask yourself whether these have to be done in a particular order. Here, yes, we want to truncate-sentinel before remove-negatives, otherwise we will lose the -999 (as a negative) before we truncate the data that follows it.
This lets us augment the diagram with information on how we got from the original input to our more useful one:
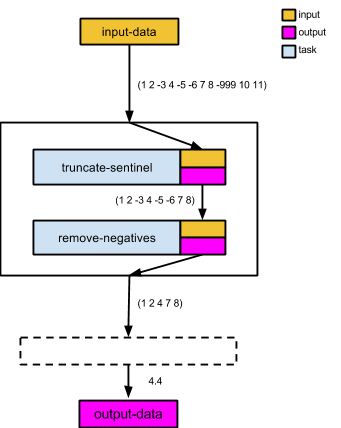
Now that you have a more useful version of the data, return to the original problem. What output should the overall problem return on this data? Figure that out, and expand the diagram:
Now you have to think about how to get from the better input to the answer. There’s no magic formula here, but think about things such as:
Do you know a formula (from outside CS) for doing that computation?
Have you learned operations in a CS class, such as sorting data, or searching for specific items, that hint at how to do the task?
Can you leverage the template?
In this case, the problem is asking you to compute the average, which is a formula you should know from other contexts. So we fill in the hole in the diagram with the computations required for average:
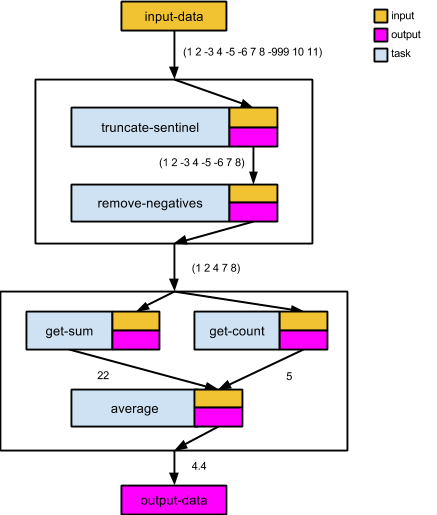
The diagram now gives you a roadmap for writing the program. Each rectangle names a task you need to perform. Each of those rectangles/tasks can become a separate function or loop (if you are working with lists) in your program. Go one rectangle at a time, writing its code. Use the arrows in the diagram to chain your functions/loops together: if you have an arrow from A to B, the result from the code for A becomes the input to the code for B.
Now, some of you may look at this and think this is a lot of code relative to what the single loop would have done. This is certainly more code. But it matters more (at least at this stage) that you get code that solves the problem at all. If you see how to do the single loop, by all means write that. But if you stare and get stuck on these problems (as some of you reported), then this method of planning and diagramming might help you get there.
2 Summary: Steps to Planning a Program
So to summarize, what were the steps here?
What is the initial format/structure of the input data?
Write a concrete example that is large enough to get at the complexity of the problem.
Is there a different version of this data (contents or format) that seems easier, or more useful, for this problem?
Show your example from the previous step in the new format.
Draw a diagram with a hole for how you get from the original to the better input.
What tasks would you need to do to convert the original input to the more useful format?
Name them explicitly. Add rectangles for each one to your diagram.
Do these tasks have to occur in a particular order?
Put the rectangles in your diagram in order, drawing arrows to show how the result of one task should feed into others. Label each arrow with what the example data should look like after that step.
What output should the overall function produce on your example?
Add a hole to the diagram whose output is the answer you are trying to produce.
Identify the tasks that you’d need to do to convert the useful data into the overall output.
Name them explicitly, and augment your diagram to include these tasks as well.
Here is the full diagram for Rainfall, labelled with the above questions.
3 Practicing Planning
Let’s now see how you approach a couple of specific problems. You don’t have to use this step-by-step approach if you see how to do the problem otherwise. But if you aren’t sure how to start, try working on examples and diagrams from the step-by-step approach to help you break the problem into pieces.
3.1 Adding Machine
Design a program called addingMachine that consumes a list of numbers and produces a list of the sums of each non-empty sublist separated by zeros. Ignore input elements that occur after the first occurrence of two consecutive zeros.
3.2 Least-Healthy Teams
A company maintains records on its employees. For each, it stores the person’s name, which team they are on on, and how many days they have been out sick. The company tracks the health of each team by totalling the number of sick days across all members of the team.
Write a function leastHealthy that takes a list of employees and returns a list of the team names in order from the one with the most to the one with the least sick days. Here’s a class of Employee to get you started.
class Employee { |
String name; |
String team; |
int missedDays; |
} |
Note that, at least here in class, it is more important that you figure out how to break the problem down into tasks than necessarily get the code written. Planning out your code before you write too much can be a useful way to make progress without getting overwhelmed by the code.