Figure 1: A typical sequence of requests for resources.
John H. Hine (John.Hine@mcs.vuw.ac.nz)
Victoria University of Wellington, Wellington, NZ,
Craig E. Wills (cew@cs.wpi.edu
)
Worcester Polytechnic Institute, Worcester, MA, USA
Anja Martel
Victoria University of Wellington, Wellington, NZ,
Joel Sommers (joel_sommers@stratus.com
)
Worcester Polytechnic Institute, Worcester, MA, USA
Performance is an important area of World Wide Web research. We investigate ways of exploiting knowledge about client behaviour and resource dependencies to improve performance. Our work explores two directions for making use of this information. One direction examines combining knowledge of client behaviour with resource dependencies to reduce latency by prefetching selected resources. The other direction uses knowledge of dependencies to influence cache replacement decisions. Results of trace driven simulations indicate the degree of performance improvement that can be obtained in both cases.
In this paper we investigate ways of exploiting knowledge about client behaviour to improve performance. The knowledge we employ includes dependencies between resources and general knowledge of a client's behaviour. Our work explores two directions for making use of this information. One direction examines combining knowledge of client behaviour with resource dependencies to reduce latency by prefetching selected resources. The other direction uses knowledge of dependencies to influence cache replacement decisions.
We believe that investigating both of these directions provides a more complete picture of the potential for use of client knowledge and resource dependencies in improving overall Web performance. Discussion on the merits of combining the two directions is presented in the summary of the paper after the independent results of each direction are presented.
The remainder of the paper begins with a presentation of related work followed by a discussion of resource dependencies as they are determined and used in our work. Section 4 provides results from combining client knowledge with resource dependencies to reduce latency through prefetching. Section 5 presents results from using resource dependencies in grouping resources for cache replacement at a proxy cache. The paper concludes with a summary of the results, the merits of combining the two directions and a discussion of future work.
There has been less work on the use of client knowledge for prefetching. Wachsberg et al. [9] developed a prefetching scheme based on past user behavior. The user's resource history list, frequently accessed pages, usage of hyperlinks (e.g. whether links at the top of a page are accessed more frequently than those lower on a page), and a keyword match were all used in determining which resources should be prefetched. In comparison to our prefetching work, this work does not utilize server information.
Also on the client side, work has been done to characterize a user's web browsing strategy as either directed search (specific topic the user is investigating), general purpose (consulting items of interest), or serendipitous (random) [4]. In contrast, we investigate a model of client behavior based on repeated access to a server rather than trying to distinguish a user browse or search mode.
Related to client behaviour in making cache replacement decisions, there has been much work on studying various cache replacement algorithms [3, 10]. However these works have concentrated on making decisions about replacing cached resources based on recent access patterns and characteristics of a resource such as size and fetch latency. In our work, we investigate the use of the dependencies between resources in making cache replacement decisions.
Embedded dependencies result in largely predictable behaviour as it is common to retrieve all embedded resources. (Most clients do offer the option to disable images but the use of this feature appears to be minimal.) Traversal dependencies (links) between resources may cause the sequence of resource requests generated by a particular client to appear to an external observer as random behaviour. The randomness arises from:
The random streams from individual clients are combined at proxies and servers. A model is needed that captures this random behaviour, but also allows us to include additional information that may be used to improve performance.
Consider a sequence of resource requests R0,R1,...Rn by a client to one or more servers. Our approach follows previous work by identifying those requests Rj that follow request Ri within a specified window of time W. See Figure 1 in which inter-request intervals less than or equal to W are shown with solid arrows and those larger than W with open arrows. This information is then processed to identify relations appropriate to the goals of the task at hand.
For our prefetching work we are primarily interested in identifying requests that are most likely to immediately follow request Ri. Thus we use an approach proposed by Bestavros [2] where a relationship exists between two successive resources Ri and Rj in the sequence, if request Rj directly follows request Ri and the delay between the requests is less than the window W. Let Pij be the probability that Rj directly follows Ri within time W. The set of probabilities P defines one particular relation. Pij measures the strength of the dependency between Ri and Rj.
A broader dependency definition is used for our cache replacement work. Here we are not interested in the order of access, but rather in identifying sets of related requests. We define a second relation Q such that Qij is the fraction of requests for resource Ri that are found in a sequence of related requests with resource Rj. References Ri, Ri+1,...,Rj are considered related as long as the time delays between successive requests for resources in the sequence are less than W.
|
|
The difference is demonstrated in Table 1. In determing P order is important and we are only interested in directly following requests. Thus, in the example of Figure 1, R1 is followed once by R3 and twice by R2 and R4 giving P13 = .17 and P12 = P14 = 0.33. However, in determing Q we identify sequences of related requests. For example, the sequences in Figure 1 that contain R2 are ( R1, R2, R3, R6), (R2, R3), (R1, R2, R4, R5), and (R1, R3, R2, R4, R5). We see that each of R1 and R3 occur in three of the sequences, R4 and R5 in two and R6 in only one. This yields Q21 = Q23 = 0.75, Q24 = Q25 = 0.50 and Q26 = .25.
|
|
For either relation a graph of resource dependencies may be constructed. Figure 2 shows two example resource dependency graphs for relations P and Q. In the graph for Q arcs with values less than .5 have been removed for clarity.
This direction of work builds on previous server-based resource dependency work, but goes much further in also determining client behaviour and using the combined information for prefetching. Server logs were used to drive a simulation study based on our approach. A diverse set of logs from the Worcester Polytechnic Institute computer science department (cs.wpi.edu), the National Center for Supercomputing Applications (NCSA) (www.ncsa.uiuc.edu), and from Sun Microsystems (www.sun.com) were obtained. Characteristics of the server logs are summarized in Table 2.
| Log | Time Frame | Duration | Requests | Requests/Hr |
|---|---|---|---|---|
| WPI | Nov. 96 -- Jan. 97 | 90 Days | 643521 | 291 |
| Sun | Dec. 96 | 1 Day | 367556 | 15315 |
| NCSA | Mar. 97 | 10 Days | 377784 | 1568 |
In characterizing client behaviour, we developed a set of client browsing modes based on the number of client accesses to a server within a single client browsing session. In contrast to the work of [4] we are not trying to characterize whether a user is browsing or searching, but how a client's activity is reflected in depth of interest for the resources at a particular site. Based on this categorization we define three types of clients as wanderer, sojourner, and resident:
Prefetching with wanderer clients is expected to be futile while doing so for resident clients should be more beneficial. Determination of a client's browsing mode by a browser can be dynamically determined by monitoring how many requests the user makes to a particular site, and using a history of these measurements to predict how long the user will stay at future sites. In our simulation study, the browsing mode is statically determined based on dividing the client accesses into sessions (a one hour break between successive accesses from a client to the server was used to define a session). Wanderers form the lower quartile of client requests per session for a server, residents form the upper quartile, and sojourners comprise the two interquartile ranges. This implementation allows us to explore the potential of combining client and server knowledge.
The approach we use is that a client asks for server suggestions by attaching to a resource request a percent threshold T between 0 and 1 indicating that it is willing to accept suggestions with a server-computed likelihood of access greater than or equal to T. In response, the server returns the requested URL and piggybacks [5] a a list of URL suggestions for client prefetching. The client can change the value of T based on the current browsing mode, the cost of access, etc.
In the simulation study, clients are distinguished by unique machine identifiers, thus machines supporting multiple browser clients such as a proxy cache are treated as a single client. While these ``fat'' clients do not reflect the behavior of an individual user, they do reflect the collective behavior of these users and may indicate that prefetching is beneficial for the collective set of users when it might not be for a specific user.
|
|
|
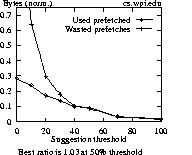
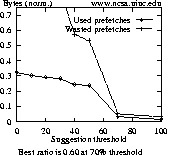
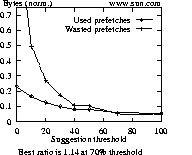
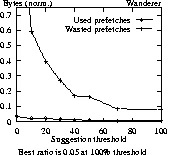
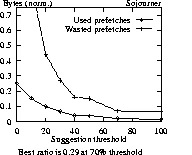
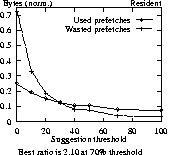
Data points of Figure 3 (and similar graphs to follow) are normalized against the number of bytes (or resources) required for a session. The best ratio for each graph attempts to capture the point in each graph where the ratio between used and wasted prefetches is maximized. A ratio of 1 indicates that prefetching is equally beneficial as it is wasteful. For ratios less than 1, more prefetches are wasted than are used, and for ratios greater than 1, more prefetches are used than are not.
Looking at the graphs of Figure 3, one notices that the NCSA plot differs from those of WPI and Sun. One explanation is that a high percentage of client sessions to NCSA involve only a single request, such as is done by the Mosaic browser when it defaults to loading the NCSA home page on startup. Since benefits from prefetching can only be realized if more than one access is made over a session, any prefetching done for a session of just one request is wasted. For the NCSA log, 66% of all sessions are composed of just one request (13054 out of 19726 total sessions). For the WPI and Sun logs, the percentage of single-request sessions is about 20% lower, at 47% and 41%, respectively. The average size of NCSA resources is also larger, which can have a significant negative impact if incorrectly prefetched.
Figure 4 gives results for different types of users accessing Sun. For wanderers and sojourners to Sun, at no point is prefetching being used more than not. For the other two logs, there is a point for sojourners where more is used from prefetching than is not used. For wanderers in all three logs, prefetching is always a losing effort (not shown). For Sun, only residents gain by prefetching. For a 70% threshold for residents, 8% of requests are satisfied from prefetched data with 4% wasted prefetches (ratio of 2.10).
|
|
|
For the NCSA log, results shown in Figure 5 show that if the number of resources is examined, 36% of all requests could be satisfied using browsing mode hints (used prefetches), compared with 11% at the best ratio for a server-suggestion strategy. The ratios of 3.60 and 1.14 for the respective schemes also support including browsing mode information. Using only server suggestions, more prefetched bytes are wasted than used. If we consider browsing modes, we could prefetch 16% of required bytes, with a ratio of 1.78.
Similar, although not as dramatic results are obtained for the WPI and Sun logs (not shown). For the WPI log 10% of resources and bytes could be retrieved from prefetching, with ratios of 1.42. For the Sun log, 7% of what is required could be prefetched, with a ratio of 1.75.
|
|
In using our resource dependency model to identify groups we have two key parameters. The window size, W, used in the model and the threshold, T, used to determine if a relationship contributes to the formation of a group. Choosing an appropriate value for W is closely tied to user behaviour. If the window is too small the model does not capture relationships. For example, a very small window might not allow the user time to inspect one resource and choose a link to follow. In this case only arcs to embedded resources would be followed a significant portion of the time. On the other hand, it is not clear if a large window would infer that relationships existed where they did not. Similarly, if we set the threshold, T, too high, we may take too restrictive a view of what constitutes a group resulting in groups that consist of embedded objects only. If we set the threshold too low our groups will be large including less frequently traversed arcs. This is demonstrated by the following table showing the results of choosing different values of T for the relation Q of Table 1 and Figure 2.
| T | Groups |
| 0.5 | R1, R2, R3, R4, R5 |
| 0.6 | R1, R4, R5 |
| 0.7 | R4, R5 |
To investigate the impact of these parameters we took the proxy cache logs from Victoria University of Wellington for the months of January, April and July 1996. We removed all requests other than the HTTP Get request. We then processed these logs using different values of W and T and examined the impact on the number and size of groups formed.
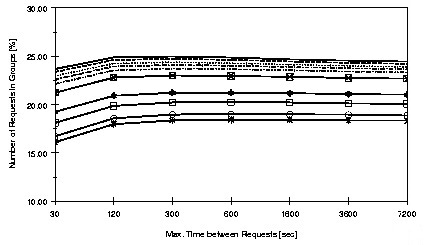
Figure 6 shows the percentage of unique requests in groups for values of W from 30 seconds through two days and of T from 10% to 100%. From Figure 6 it is evident that choosing too small a window can reduce the number of resources in groups as discussed above. Increasing the window beyond two minutes has minimal impact. This suggests that most groups are formed from embedded objects and links that are followed reasonably quickly.
The figure also suggests that choosing a threshold in the vicinity of 60% or 70% captures most groups of resources. Further decreasing the threshold does include additional resources, but the increments are diminishing. For the remainder of this section we present results using values of 2 minutes for W and either 60% or 70% for T. Table 3 gives specific results for the three logs for T = 60%. It should be noted that while only 20-22% of unique requests are in groups about half of the total number of requests are in groups.
| January | April | July | |
|---|---|---|---|
| No. of requests | 564,334 | 1,140,640 | 1,719,431 |
| No. of groups | 9,220 | 19,605 | 26,679 |
| No. of unique request in groups | 58,802 | 126,667 | 189,613 |
| Average size group | 5.82 | 6.41 | 7.11 |
Since we are planning to use groups to modify a caching algorithm it is important to know how frequently groups repeat. For instance, groups of resources that were regularly accessed on the first of each month are of minimal value for cache replacement, but groups that are accessed several times a day may be. Figure 7 shows the frequency histogram of the intervals between references to members of groups and Figure 8 shows the frequency with which groups recur. From Figure 8 we see that many groups occur only a few times within the months log. However, other groups do occur a significant number of times, explaining why groups containing only 22% of the unique resources can account for more than 50% of the total load. From Figure 7 we see that over half the intervals between references to members of a group are less than two days.
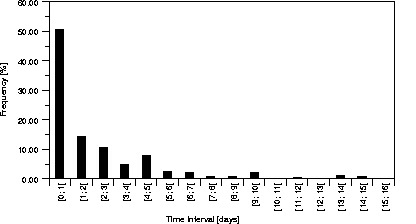
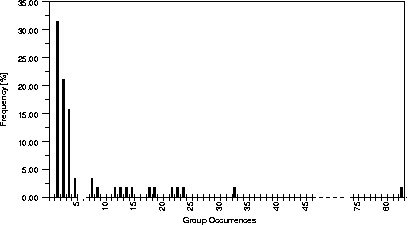
Figure 8: Distribution of Frequency of Requests for
Groups (nz.com, probability=70%).
To evaluate this algorithm we used a trace driven simulation employing the same logs that we had used to identify the groups. Our proxy cache was primed with knowledge of the groups at the start of each simulation.
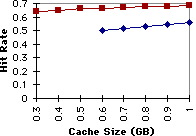
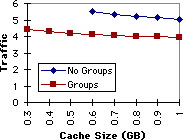
We are interested in two performance indicators for the proxy cache. The hit rate indicates the proportion of requests satisfied from the cache. This directly impacts the latency observed by users. The second indicator is the amount of traffic between the proxy cache and the various servers. This directly impacts the cost of accessing the resources.
|
|
|
Figure 9: Hit Rate for April 1996 with W = 120 sec. and T = 60%. |
Figure 10: Traffic for April 1996 with W = 120 sec. and T = 60%. |
Figures 9 and 10 show the performance of fixed size caches of various sizes. The performance of both the standard LRU replacement algorithm and the algorithm modified to take advantage of groups is plotted. The graphs show that the hit rate can be increased by 15% to 20% and the traffic reduced by 20% to 25%. These represent significant savings.
We have also shown 15-25% improvement in hit and byte hit ratios for proxy caches by modifying the replacement algorithm to take advantage of knowledge of related resources. Our experiments covered a wider range to parameters than we are able to present in this paper, however all results were similiar.
Combined results of work suggest that knowledge of client behaviour and resource dependencies can effectively improve client performance, particularly for proxy cache clients. Proxies tend to be residents with more collective depth of interest at particular servers. Consequently proxies can use resource dependencies known by servers to prefetch groups of related resources for reduced latency and use these same groups in making cache replacement decisions.
Future work includes integrating these approaches to allow information to be collected at the most efficient point: browser, proxy or server. The information can then be piggybacked on other messages to those components that can make use of it. In particular this approach can be used to communicate information about groups from servers to proxy caches eliminating the need to identify groups at each proxy cache.