that's it?

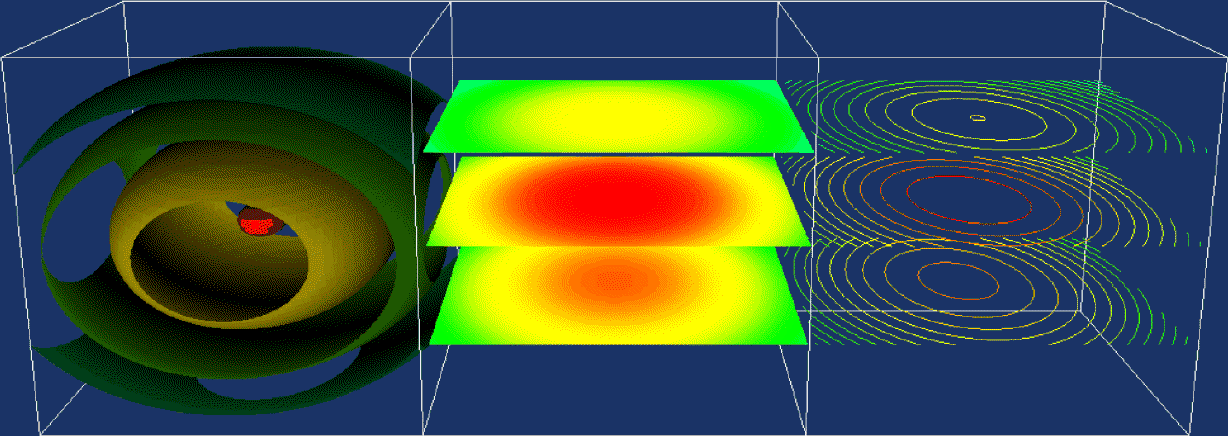
| The leftmost picture displays surface contours at specific values (isosurfaces). The middle picture cuts the space into three distinct planes and then provides a color ramp based on the value in the (x,z) position of the plane. The rightmost picture provides a line contour of values in three horizontal planes of the space. |
// Sample quadric function quadric = new vtkQuadric; quadric->SetCoefficients(1,2,3,0,1,0,0,0,0,0); sample = new vtkSampleFunction; sample->SetSampleDimensions(40,40,40); sample->SetImplicitFunction(quadric); // Generate implicit surface contour = new vtkContourFilter; contour->SetInput(sample->GetOutput()); range[0] = 1.0; range[1] = 6.0; contour->GenerateValues(3,range); // Map contour contourMapper = new vtkPolyMapper; contourMapper->SetInput(contour->GetOutput()); contourMapper->SetScalarRange(0,7); contourActor = new vtkActor; contourActor->SetMapper(contourMapper); |
|
Color mapping is a scalar visualization technique that maps scalar
data to colors. Below are four different mappings of scalar data to colors.
The data corresponds to gas density as fluid flows through a combustion
chamber. The code to the right is common throughout the four examples. Each of the examples varies only in the lookup table assignments. |
  plane = new vtkStructuredGridGeometryFilter;
    plane->SetInput(datafile);
    plane->SetExtent(1,100,1,100,7,7);

  lut = new vtkLookupTable;

  planeMapper = new vtkPolyMapper;
    planeMapper->SetLookupTable(lut);
    planeMapper->SetInput(plane->GetOutput());
    planeMapper->SetScalarRange(0.197813, 0.710419);

  planeActor = new vtkActor;
    planeActor->SetMapper(planeMapper);
|
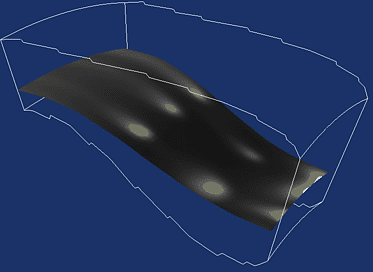 |
Greyscale tables usually provide better
structural details.
lut->SetHueRange(0,0); lut->SetSaturationRange(0,0); lut->SetValueRange(0.2,1.0); |
|
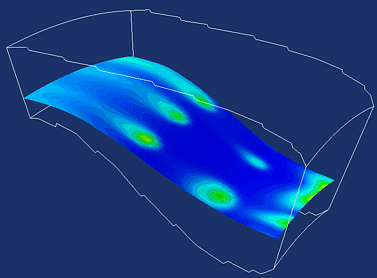
Rainbow - blue to red.
// Since the default lut is // a rainbow lut, we only have // to worry about the hue range. lut->SetHueRange(0.667,0.0); |
 |
|
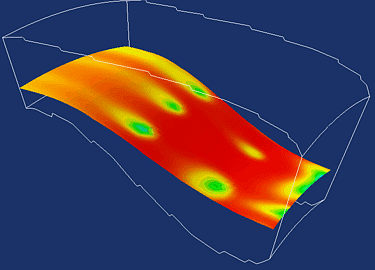 |
Rainbow - red to blue.
// Since the default lut is // a rainbow lut, we only have // to worry about the hue range. lut->SetHueRange(0.0,0.667); |
|
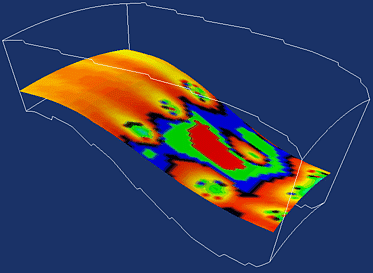
This example uses a lookup table
specially designed to enhance
contrasting values.
  lut->SetNumberOfColors(64);
  lut->Build();
  for(i=0;i<16;i++) {
    lut->SetTableValue(i*16,red);
    lut->SetTableValue(i*16+1,green);
    lut->SetTableValue(i*16+2,blue);
    lut->SetTableValue(i*16+3,black);
  }
  lut->SetTableValue(0,coral);
  lut->SetTableValue(1,black);
  lut->SetTableValue(2,peacock);
  lut->SetTableValue(3,black);
  lut->SetTableValue(4,orchid);
  lut->SetTableValue(5,black);
  lut->SetTableValue(6,cyan);
  lut->SetTableValue(7,black);
  lut->SetTableValue(8,mint);
  lut->SetTableValue(9,black);
  lut->SetTableValue(10,tomato);
  lut->SetTableValue(11,black);
  lut->SetTableValue(12,sea_green);
  lut->SetTableValue(13,black);
  lut->SetTableValue(14,plum);
  lut->SetTableValue(15,black);
|
 |
The premise of any contour is the following: fix a dependent value at some constant c, and then draw the resulting line, surface, or region only at that value. Also called "iso-surfacing", this is easily implemented using a Marching Cubes algorithm.
The 2-dimensional contour lines of CT density values corresponding
to different tissue types.
  // Read in the data.
  v16 = new vtkVolume16Reader;
    v16->SetDataDimensions(128,128);
    v16->GetOutput()->SetOrigin(0.0,0.0,0.0);
    v16->SetFilePrefix("../../data/headsq/half");
    v16->SetImageRange(45,45);
    v16->SetDataAspectRatio(1.6,1.6,1.5);

  // Set up a contour filter.
  iso = new vtkContourFilter;
    iso->SetInput(v16->GetOutput());
    iso->GenerateValues(12,500,1150);

  // Map the contour output to polygons
  // and create the actor!
  isoMapper = new vtkPolyMapper;
    isoMapper->SetInput(iso->GetOutput());
  isoActor = new vtkActor;
    isoActor->SetMapper(isoMapper);
    isoActor->GetProperty()->SetColor(black);
|
 |
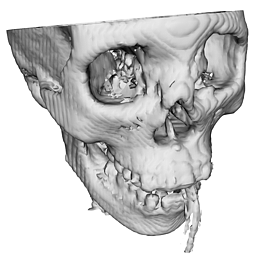 |
A three dimensional isosurface of another CT.
  // Read in the data.
  v16 = new vtkVolume16Reader;
    v16->SetDataDimensions(128,128);
    v16->GetOutput()->SetOrigin(0.0,0.0,0.0);
    v16->SetFilePrefix("../../data/headsq/half");
    v16->SetImageRange(1,93);
    v16->SetDataAspectRatio(1.6,1.6,1.5);

  // Notice the constant iso-value, rather than
  // the range we used in the previous example.
  iso = new vtkMarchingCubes;
    iso->SetInput(v16->GetOutput());
    iso->SetValue(0,1150);

  // Map to polys and create the actor.
  isoMapper = new vtkPolyMapper;
    isoMapper->SetInput(iso->GetOutput());
  isoActor = new vtkActor;
    isoActor->SetMapper(isoMapper);
    isoActor->GetProperty()->SetColor(antique_white);
|
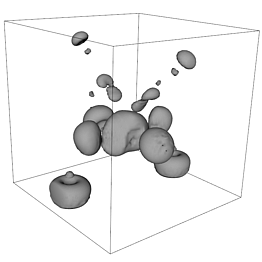
An isosurface of the electron potential of
an iron protein molecule.
  // Read in the data. Note the different
  // file format this time.
  reader = new vtkStructuredPointsReader;
    reader->SetFilename("../../data/ironProt.vtk);

  // Set up the contour.
  iso = new vtkContourFilter;
    iso->SetInput(reader-> GetOutput());
    iso->SetValue(0,128);

  // Clean up duplicate points.
  clean = new vtkCleanPolyData;
    clean->SetInput(iso->GetOutput());

  // Smooth any two edges if the angle
  // between them is less than 45 degrees.
  normals = new vtkPolyNormals;
    normals->SetInput(clean->GetOutput());
    normals->SetFeatureAngle(45);

  // Map to polygons and make the actor!
  isoMapper = new vtkPolyMapper;
    isoMapper->SetInput(normals->GetOutput());

  isoActor = new vtkActor;
    isoActor->SetMapper(isoMapper);
    isoActor->GetProperty()->SetColor(bisque);
|  |